- Despite a 3% price rise in the last 24 hours, only 59% of investors were in profit.
- Most of the on-chain metrics turned bearish on the memecoin.
PEPE has showcased promising performance in the last 24 hours as the market condition turned somewhat bullish. There was better news for PEPE investors as the memecoin’s price was consolidating inside a pattern.
A breakout above that could result in a massive bull rally.
PEPE is consolidating
CoinMarketCap’s data revealed that after a slow-moving week, PEPE’s price surged by more than 3% in the past 24 hours. At the time of writing, the memecoin was trading at $0.000008678 with a market capitalization of over $3.6 billion, making it the 24th largest crypto.
However, despite the recent price uptick, only 167.4k PEPE addresses were in profit, which accounted for 59% of all PEPE addresses.

Source: IntoTheBlock
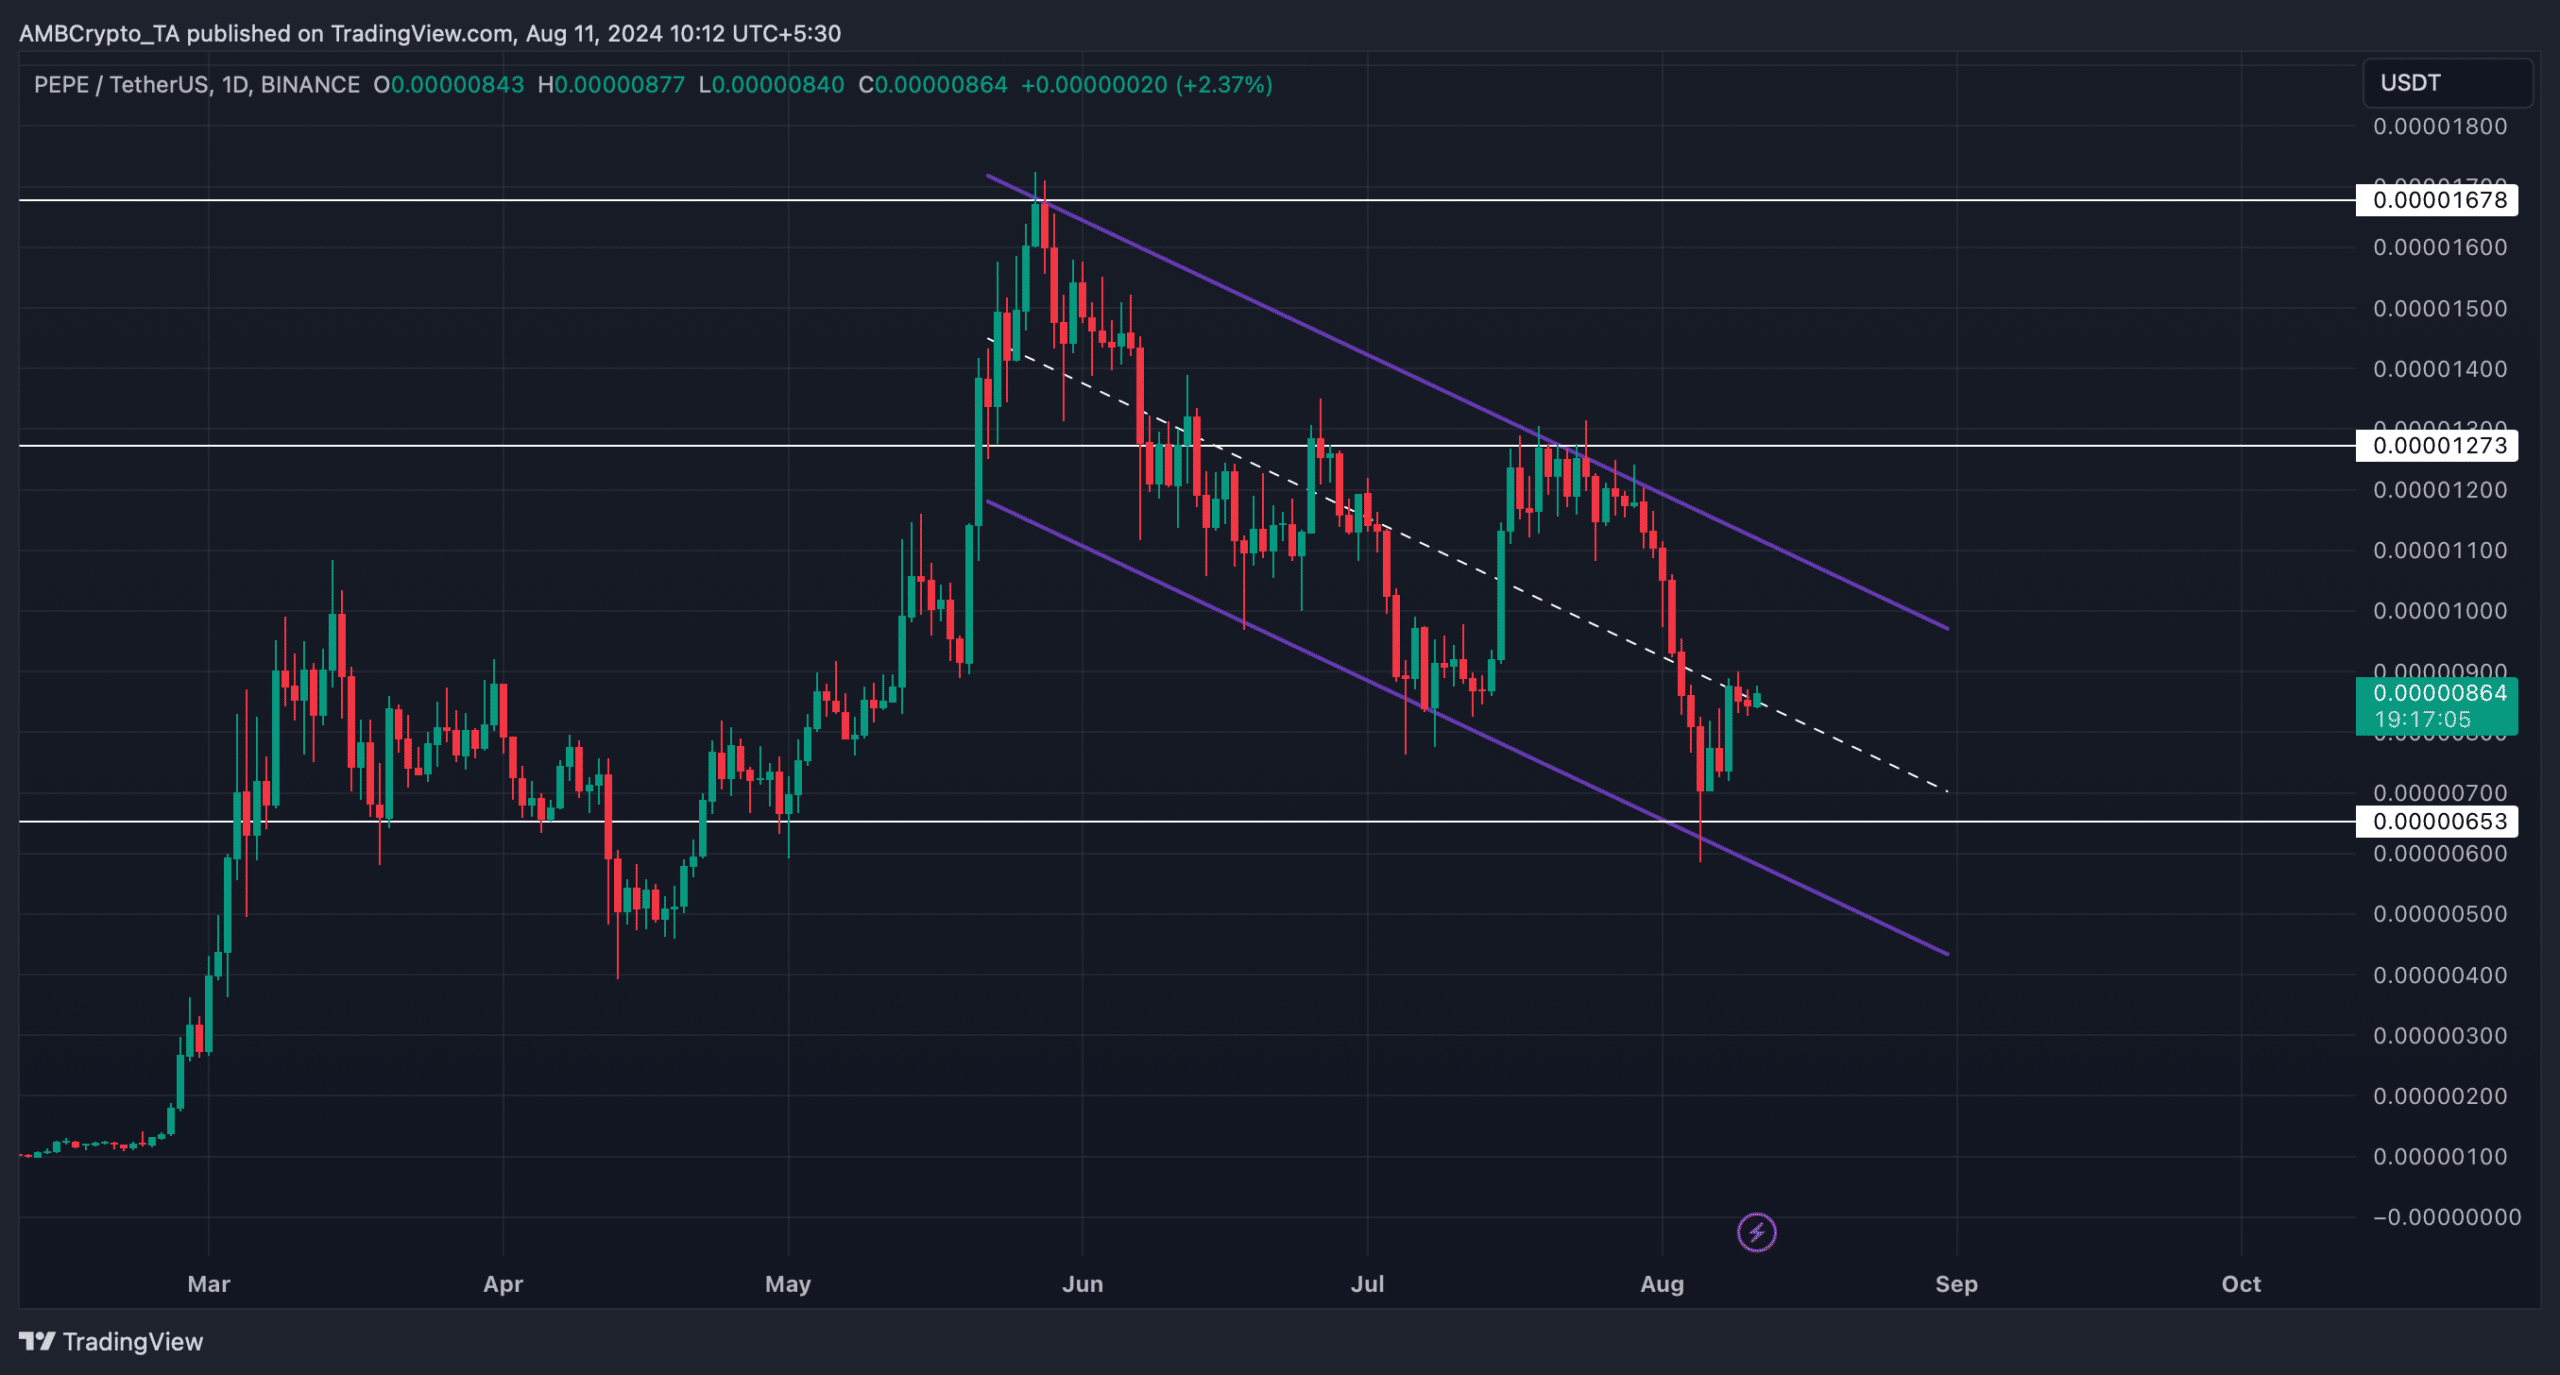
Meanwhile, AMBCrypto’s look at PEPE’s price chart revealed that a down channel pattern appeared on the memecoin’s chart.
The pattern emerged in June, and since then the memecoin has been consolidating inside it. The recent price uptick might allow PEPE to test the upper resistance of the pattern.
A successful breakout above it might first allow PEPE to reclaim $0.0000127. In case of a jump above that, then investors might witness PEPE retest its June highs.
However, if the bears takeover once again, then the memecoin might plummet to its support at $0.00000653.


Source: TradingView
Will bulls remain dominant?
AMBCrypto then checked PEPE’s on-chain data to find out whether the bulls would maintain this lead, which could allow PEPE to break above the pattern.
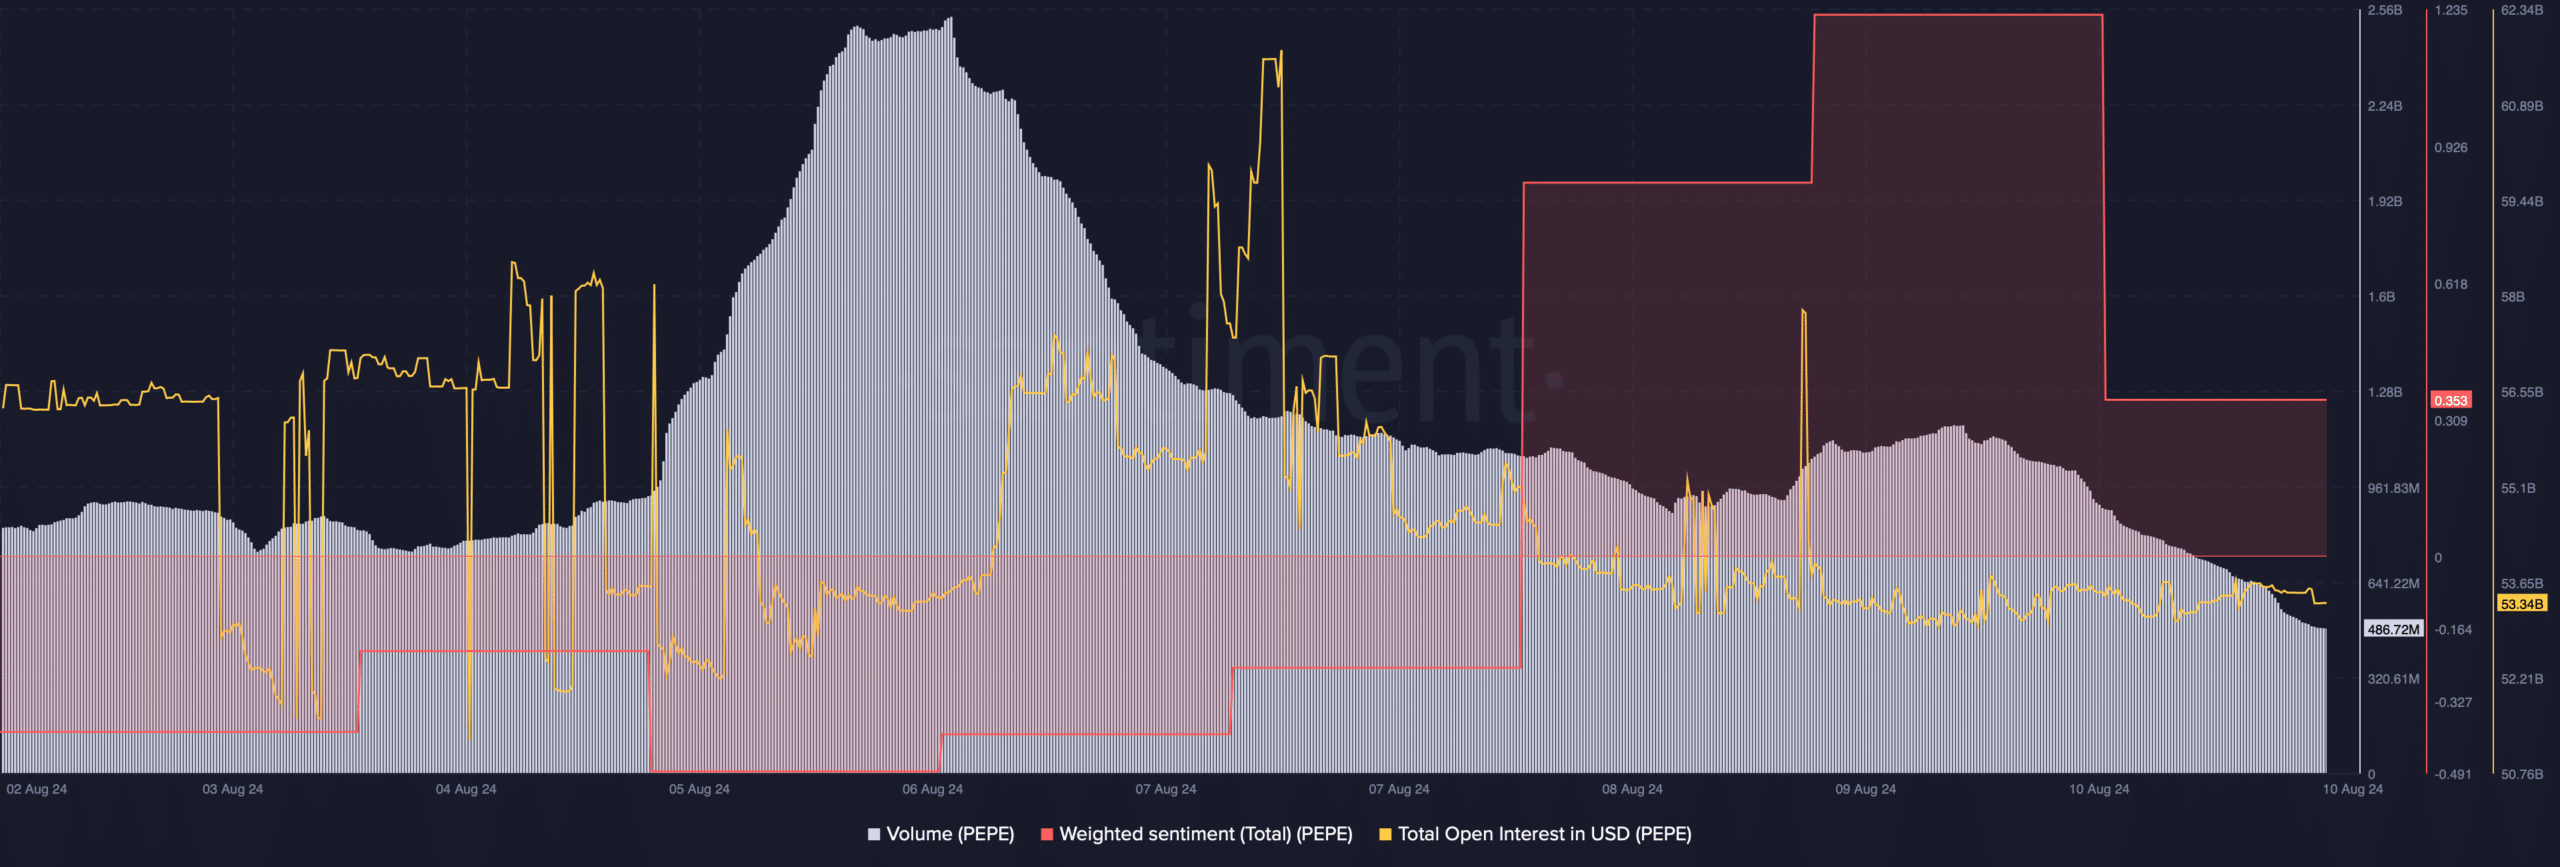
As per our analysis of Santiment’s data, the memecoin’s trading volume declined in the last few days while its price increased. This is generally considered a bearish development.


Source: Santiment
After a considerable spike, the memecoin’s weighted sentiment dropped, indicating that bullish sentiment around it was dropping.
On top of that, the memecoin’s open interest also dropped. Whenever the metric dips, it suggests that the chances of a trend reversal are high.
Apart from this, Coinglass’ data revealed that PEPE’s long/short ratio registered a sharp decline. This meant that there were more short positions in the market than long positions, indicating a rise in bearish sentiment.


Source: Coinglass
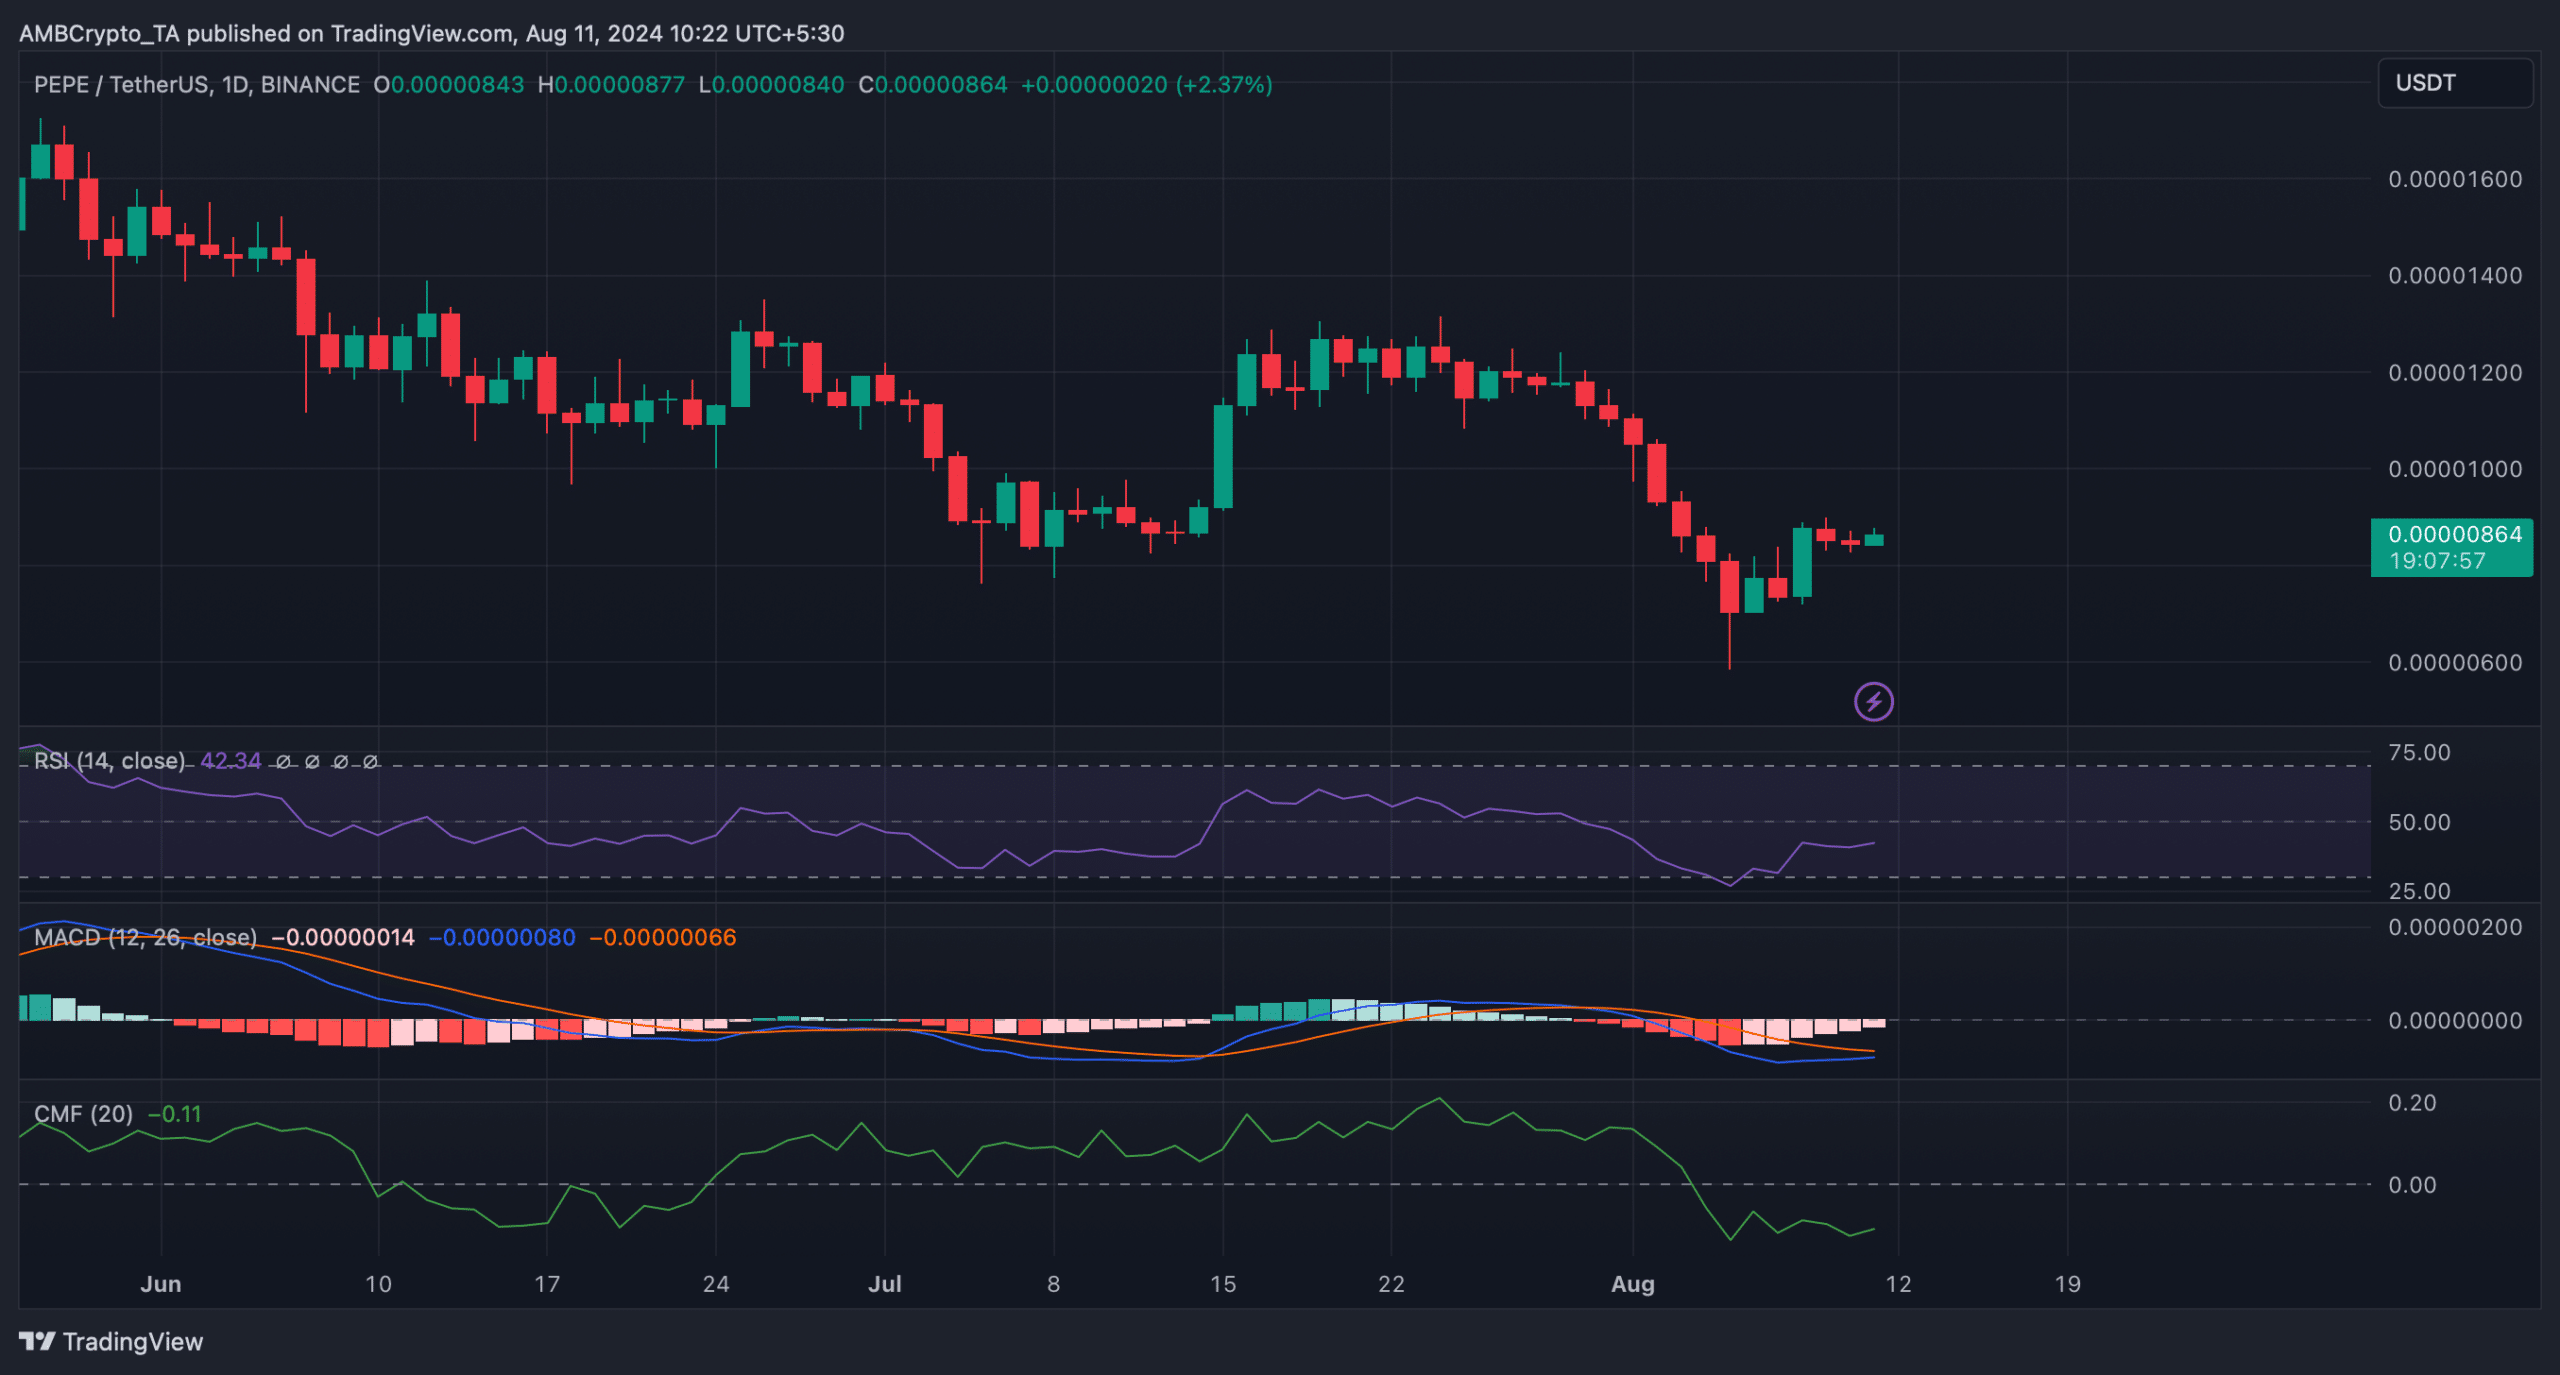
The technical indicator Chaikin Money Flow (CMF) was resting well below the neutral mark.
Realistic or not, here’s PEPE’s market cap in BTC’s terms
The Relative Strength Index (RSI) also moved sideways. Both of these indicators suggested that the memecoin might experience a few more slow-moving days.
Nonetheless, MACD displayed the possibility of a bullish crossover for PEPE, which hinted at a continued price rise.


Source: TradingView

