
- Ethereum’s dominance dipped below 14%
- Short-term net inflows suggested selling pressure, while long-term outflows indicated potential accumulation
Ethereum’s (ETH) dominance within the crypto market fell from 18.85% a year ago to 13.36%. This represented a considerable drop in ETH’s share of the total crypto market, as noted by analyst Benjamin Cowen. In fact, the aforementioned drop can be seen as a sign of persistent selling pressure. Especially as ETH struggles to hold higher dominance levels.
Historically, Ethereum has faced resistance at the 16% and 22% dominance levels, failing to break through these barriers multiple times since 2018. Its ongoing decline is part of a descending triangle pattern – Generally a sign of a bearish trend.
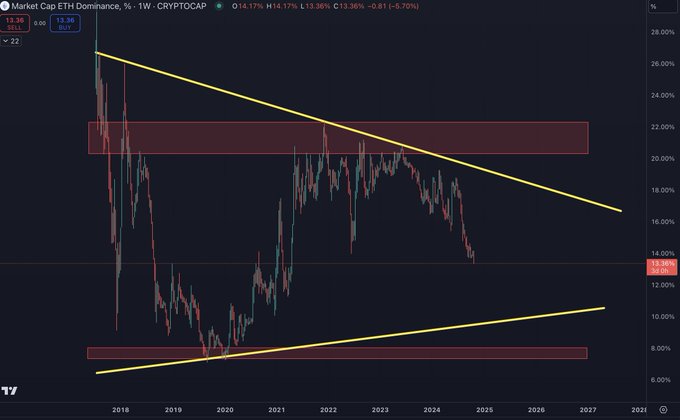
Source: TradingView
In the attached chart, the upper trendline highlighted lower highs, while the lower trendline acted as a long-term support level.
Free-fall to 9-10% ETH dominance?
According to Cowen, if the downward momentum continues, the next major support level could be between the 9% and 10% dominance levels. This would represent a deeper decline, driven by falling buying interest.
The historical support around 9% could become a crucial point for ETH, especially if broader market trends don’t favor the altcoin sector in the coming months.
If this support level holds, ETH’s dominance might stabilize, setting the stage for a potential rebound in 2025. However, if ETH breaks below the 9% mark, it could signal a more extended period of underperformance, relative to other altcoins and the overall crypto market.
Ethereum’s recent price action and market activity
Ethereum was trading at $2,542.29 at press time, with a 0.59% hike in the last 24 hours and a -3.11% decline over the past week. Its 24-hour trading volume stood at approximately $17.6 billion – A sign of active trading. With a circulating supply of 120 million ETH, the market cap seemed to be around $306.29 billion.
According to DefiLlama data, the Total Value Locked (TVL) on Ethereum’s network was $47.91 billion at press time, with daily fees amounting to $3.55 million and revenue at $2.55 million. Over the past 24 hours, inflows to the network were about $38.78 million, and the number of active addresses was 372,911.
These metrics, together, highlighted Ethereum’s sustained use, despite its declining dominance.
Netflow data underlines short-term selling pressure
Finally, data from IntoTheBlock highlighted a +52.90% hike over the past 7 days and a +28.94% uptick over the last 30 days, indicating a rise in inflows to exchanges. Such a trend is often seen as traders move assets to platforms in preparation for selling or profit-taking.
Over a 90-day period, however, there was a massive -64,155.88% shift towards net outflows – Pointing to a longer-term trend of investors withdrawing ETH from exchanges.
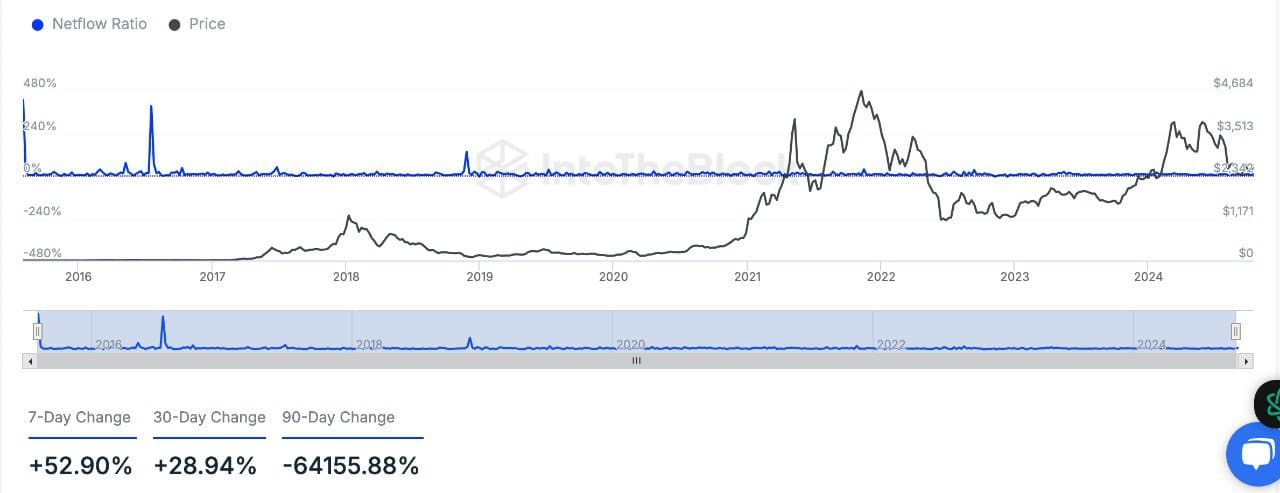
Source: IntoTheBlock
The hike in short-term inflows aligns with the market’s wider bearish sentiment. Especially as more Ethereum is moved to exchanges, typically signalling an intent to sell.
On the contrary, net outflows over a longer period indicate possible accumulation, as users move ETH off exchanges for storage or staking.
Taken together, analysts believe that while ETH could see further declines in the short term, a potential bounce can be expected in 2025.