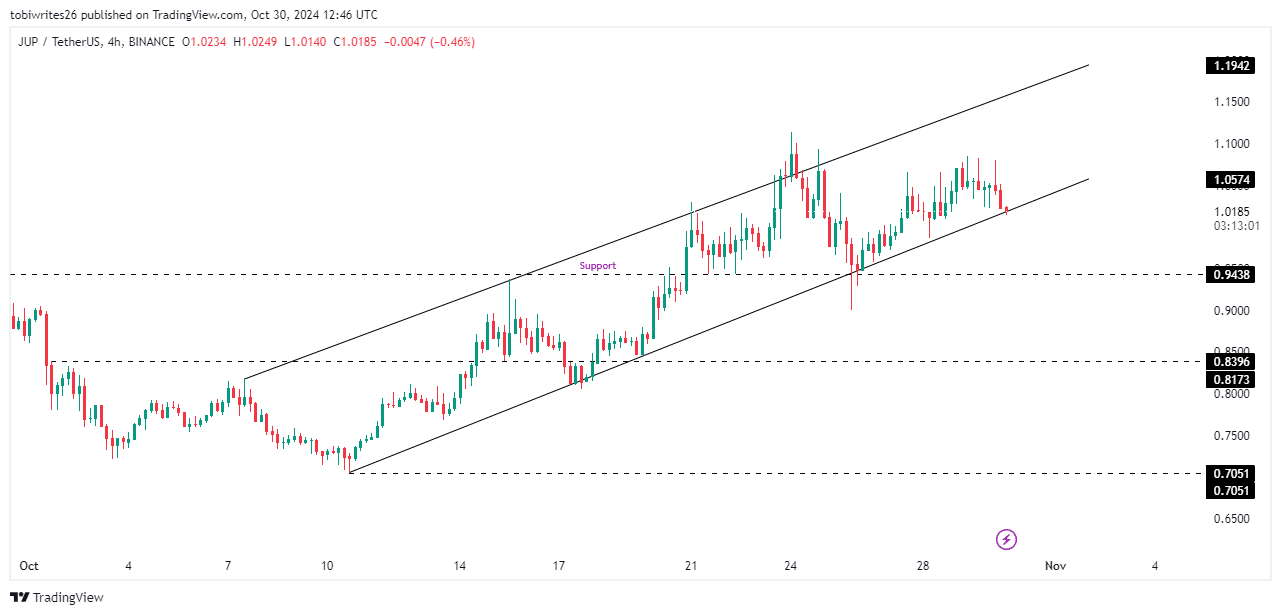
- JUP has been trading within an ascending channel – A pattern often preceding a downturn
- Market indicators supported this bearish outlook, owing to declining Open Interest and a hike in Exchange Netflows
After a recent rally briefly pushed JUP above $1, the asset started retracing, bringing its monthly gains to just 14.69%. In fact, over the last 24 hours alone, JUP dropped by 2.33% on the charts.
AMBCrypto’s analysis revealed that JUP may face additional depreciation going forward, especially as the asset appears primed for a sustained downtrend.
Bearish pattern could trigger JUP’s decline
At the time of writing, JUP seemed to be trading within an ascending channel – A pattern where prices oscillate within a defined range, trending upwards, typically followed by a sharp fall.
At the support floor of this channel, JUP could retest stability at a nearby support level around $0.9438, potentially prompting a short-term rebound.
However, a breach below this level could push JUP to lower targets, with $0.8396 likely offering a minor bounce before a final drop to $0.7051 – The base of the ascending channel.

Source: Trading View
A further analysis by AMBCrypto revealed a hike in on-chain selling activity, reinforcing the bearish outlook.
Lack of confidence drives JUP’s sell-off
Investors appear to be losing confidence in JUP though, as reflected by recent hikes in the daily and weekly Exchange Netflows.
At the time of writing, Exchange Netflows showed positive readings of $565,590 for the daily and $7.01 million for the weekly timeframes, indicating that investors are moving assets from private wallets to exchanges. This is often a signal of selling pressure, in anticipation of further declines.
Additionally, Coinglass reported a 4.13% drop in JUP’s Open Interest (OI), with a value of $135.18 million. This suggested that more short positions are being opened and maintained.


Source: Coinglass
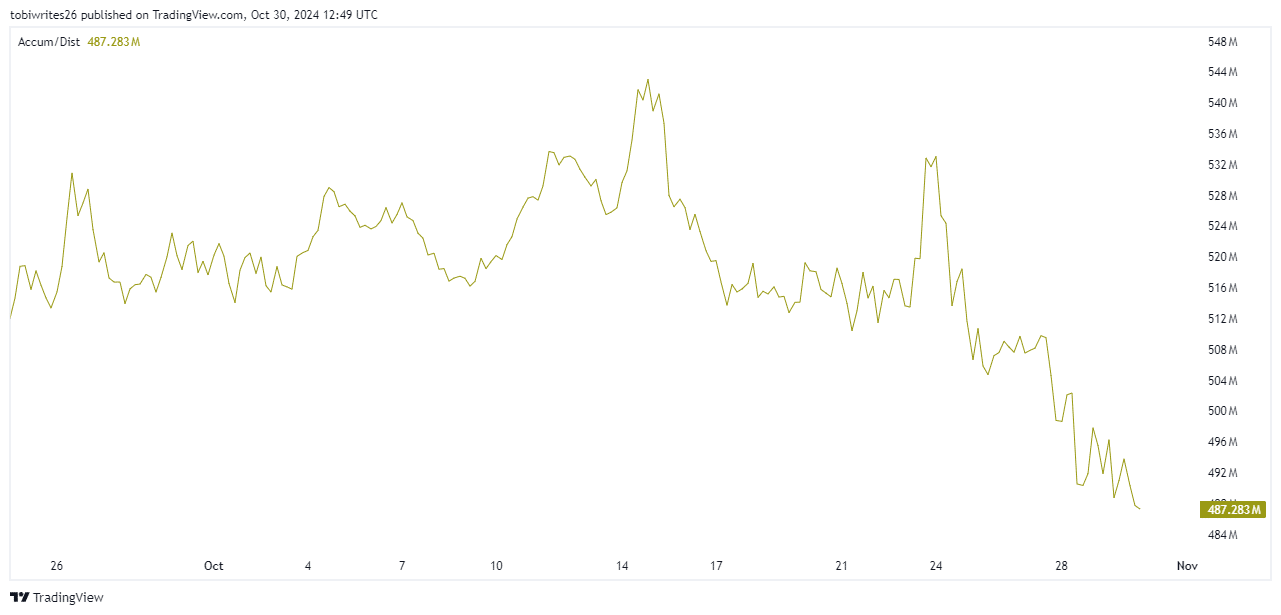
With both metrics pointing towards a downtrend, the Accumulation/Distribution (A/D) indicator further confirmed ongoing selling activity in the market.
More selling activity detected
Finally, it’s worth looking at the Accumulation/Distribution (A/D) indicator too. It tracks supply and demand by analyzing price and volume and rises with strong buying and falls with strong selling – A sign of potential trend shifts.
For JUP, the indicator has been in a steep decline since 24 October. It had a reading of 485.311 at press time, reflecting significant selling pressure on the charts.


Source: Trading View
If this downtrend persists, JUP’s breakdown from its ascending channel appears likely, potentially pushing the asset towards the lower target of $0.7051.

