- Cardano’s price broke through another crucial price level on the charts
- ADA’s price level fueled FOMO within the market
Cardano (ADA) has been making headlines recently, with its price action sparking discussions about its potential to reach a new milestone by mid-2025. With both technical and on-chain metrics flashing mixed signals, this ambitious target has captivated investors and analysts alike.
Let’s dive into the data to evaluate whether ADA’s price has what it takes to climb these heights.
Cardano’s price momentum – A breakout in progress?
Cardano, at the time of writing, was trading near $0.72, following gains of over 20% in the last 24 hours. This surge marked a significant breakout above its 50-day and 200-day moving averages, at $0.39 and $0.38, respectively.
Such a move is often a sign of strong bullish momentum in the short term, with buyers firmly in control.
Additionally, the Relative Strength Index (RSI) climbed to 82.81, pushing the altcoin into overbought territory. While this could be a sign of strong buying pressure, it also seemed to hint at the potential for a short-term correction. Especially since traders may look to take profits.
Source: TradingView
Another key indicator to note is the Fibonacci retracement level. Cardano has tested the 0.618 retracement level, going past $0.7 – A critical resistance zone. Breaking through this level could pave the way towards $0.80 – A key target in its upward trajectory.
Meanwhile, the MACD indicator flashed a positive trend, with its line ascending steadily while reinforcing the prevailing bullish sentiment. However, sustained momentum will be necessary to overcome the looming resistance level.
Cardano’s on-chain metrics – Network activity and accumulation
At the time of writing, on-chain activity painted a compelling picture of Cardano’s potential growth.
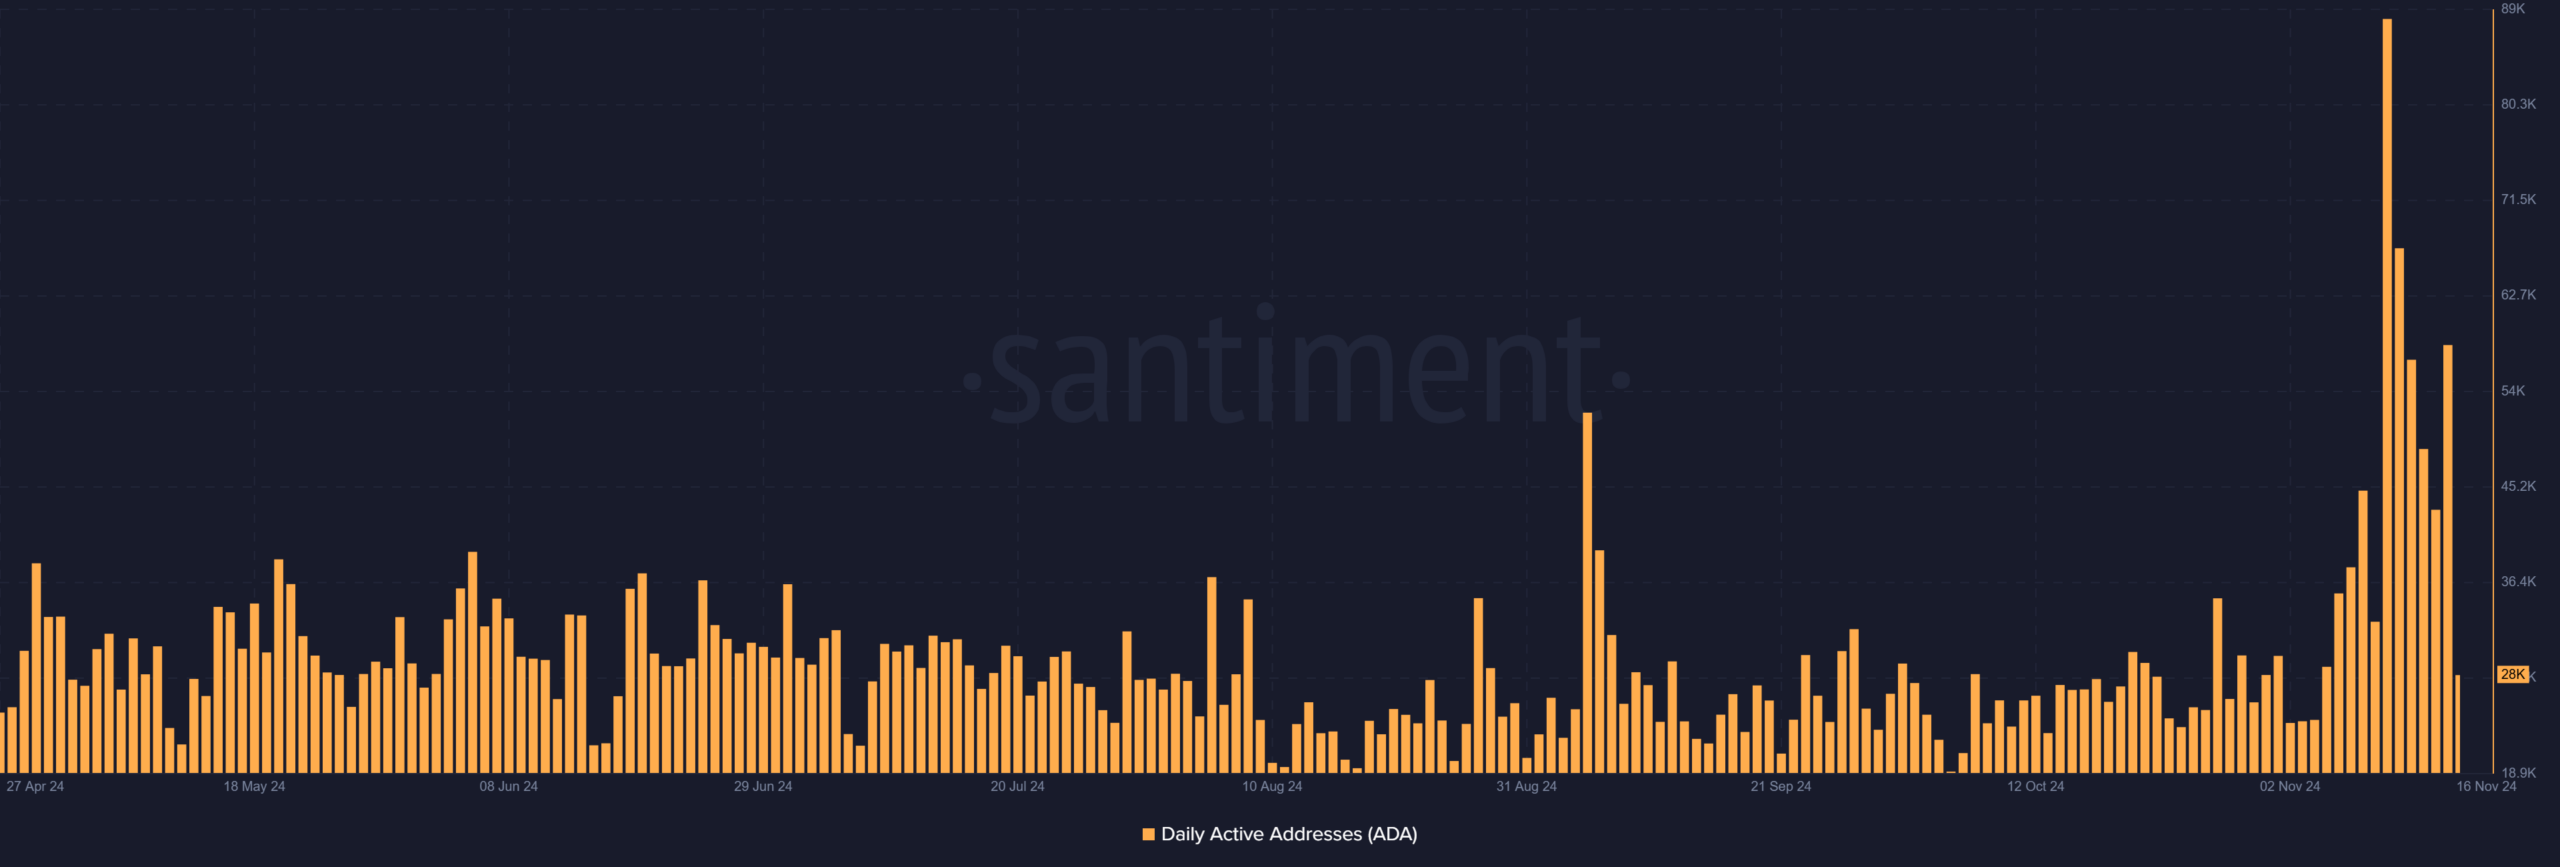
Daily active addresses were over 58,000 in the last trading session, according to data from Santiment. This highlighted a marked hike in network usage.

Source: Santiment
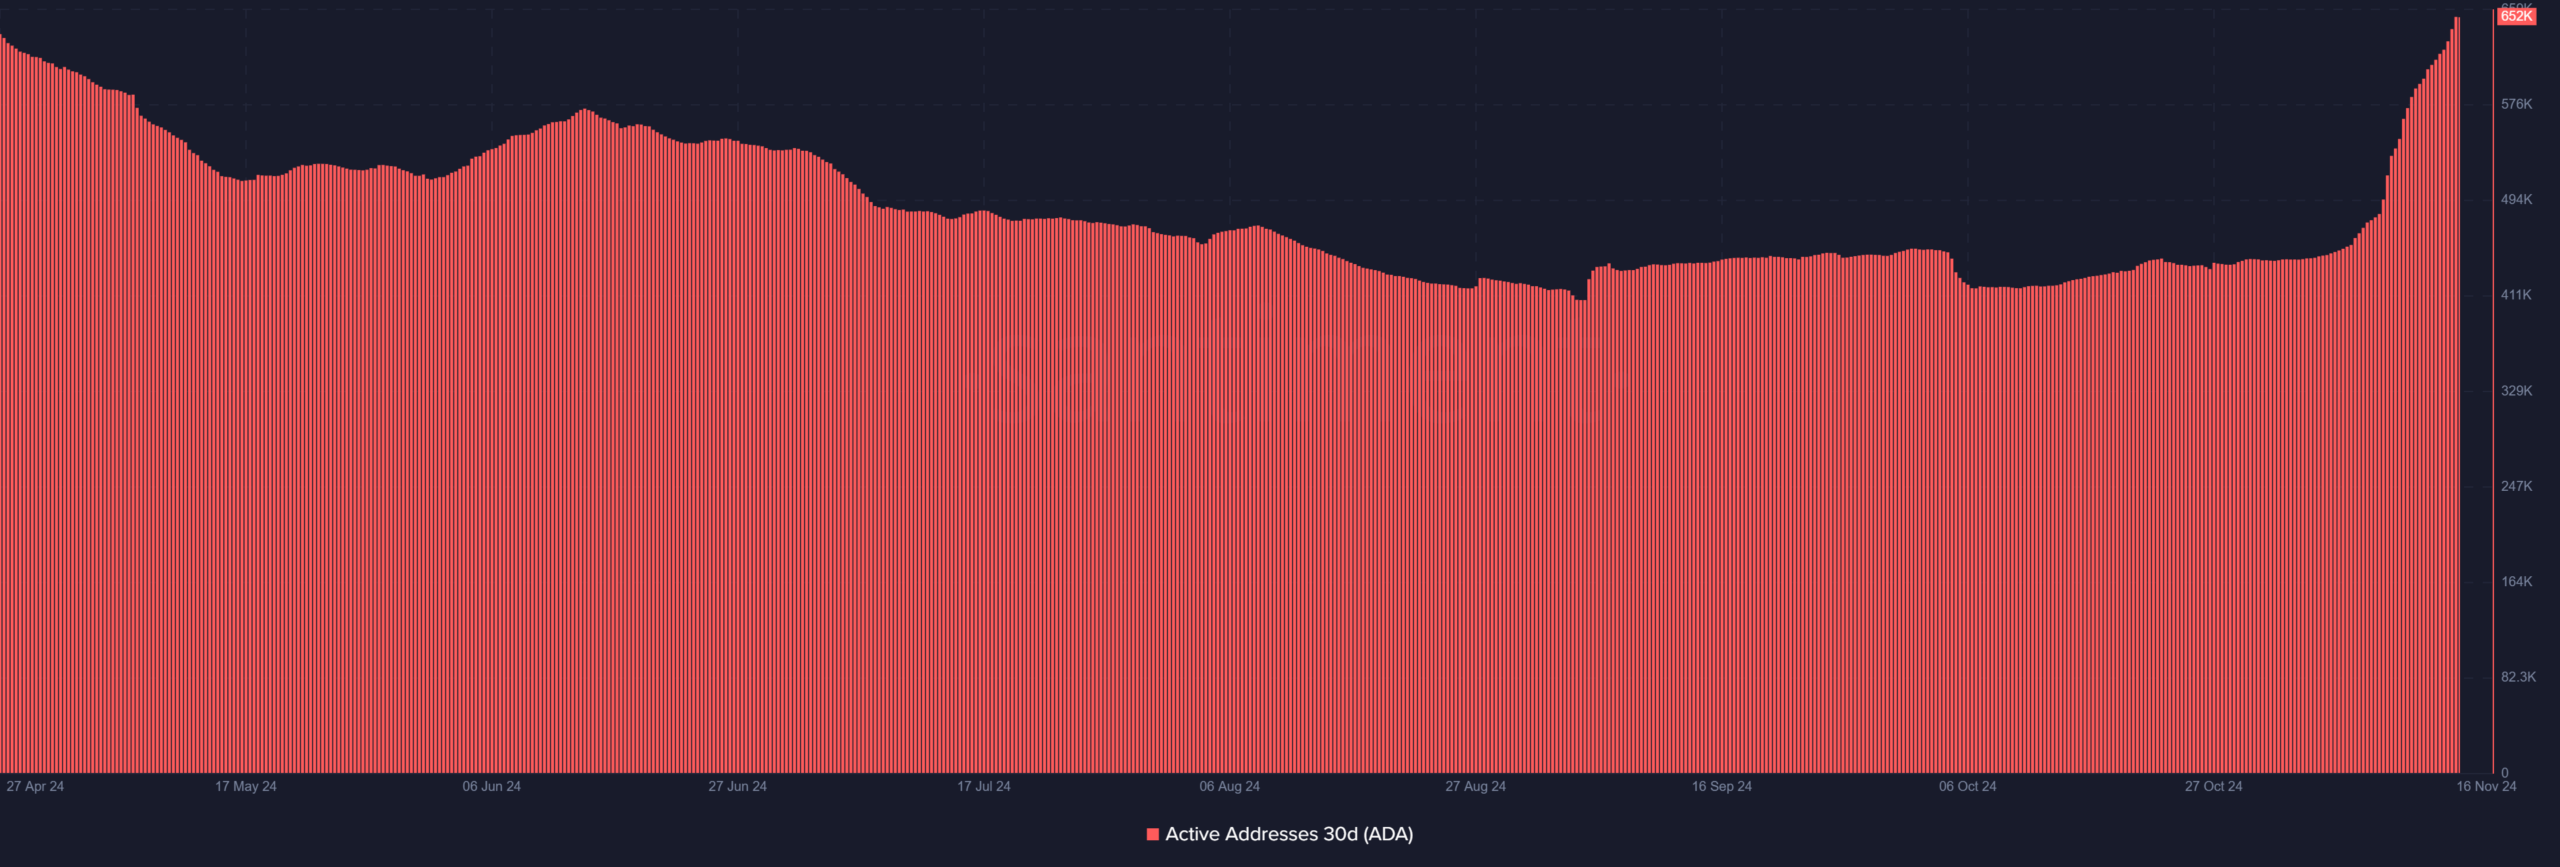
Also, over the past month, 30-day active addresses hit a notable figure of 637,000, underscoring consistent user engagement.
These figures indicated that Cardano’s ecosystem has been gaining traction – An encouraging sign for long-term growth.

Source: Santiment
Derivatives data – Long liquidations hint at FOMO
Cardano’s latest rally has sparked increased trading activity in the derivatives market.
In fact, data from Coinglass revealed a significant hike in long positions, accompanied by significant short liquidations. This trend underlined the growing confidence among traders while also showing the risks of over-leverage. The liquidation chart also revealed that most liquidations occurred near $0.55 – A sign that this level may now act as a strong support zone.

Source: Coinglass
Moreover, funding rates have remained positive throughout the rally, indicating that traders are paying a premium to maintain long positions.
This bullish sentiment is in line with the broader optimism surrounding Cardano’s price action. However, caution is warranted, as excessive leverage could amplify volatility in the event of a market correction.
– Realistic or not, here’s ADA market cap in BTC’s terms
Cardano’s recent performances and network growth offer promising signs of a potential rally. However, achieving this ambitious target will depend on its ability to maintain bullish momentum, overcome key resistance levels, and capitalize on ecosystem growth.

