- Spot markets are seeing sell pressure, and derivative traders remain optimistic, helping keep POL on a bullish trajectory.
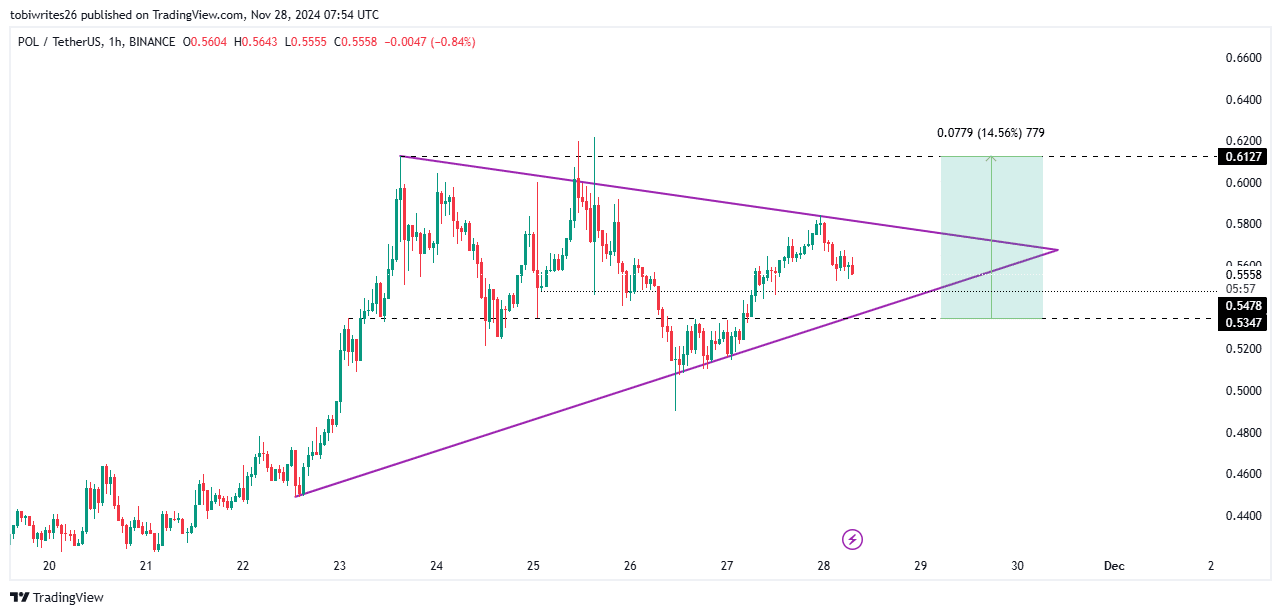
- The technical chart shows that POL is in an accumulation phase, as indicated by the symmetrical triangle pattern.
Polygon [POL] has delivered impressive gains recently. Over the past month, the asset rose 66.28%, with weekly and daily increases of 27.43% and 2.02%, respectively.
With strong market sentiment and continued accumulation, POL looks set to push beyond its current daily increase of 2.02%, maintaining its upward momentum.
Derivatives traders push POL towards bullish momentum
Data from Coinglass shows that while investors are accumulating POL, derivatives traders have also joined the trend.
Open Interest (OI), which measures the total number of unsettled futures contracts, has risen by 1.82% to $115.87 million. This growth highlights increased activity in the derivatives market, with long positions dominating and POL nearing its previous all-time high in OI.

Source: Coinglass
The Open Interest Weighted Funding Rate, a metric that reflects funding costs and directional bias based on OI, indicates that POL is likely to climb further after a major uptick and a value of 0.0023%.
These metrics point to a bullish outlook driven by derivatives traders, even as AMBCrypto notes that spot traders continue selling.
Can POL withstand selling pressure?
Spot traders have started offloading POL on exchanges, which shows a fading interest in the asset.
Exchange Netflow, a metric that tracks whether traders are holding for the long term or selling, shows that $4.1 million worth of POL was moved to exchanges in the past 24 hours for potential sell-offs.


Source: Coinglass
Despite this, AMBCrypto found an ongoing accumulation in the technical chart. If this persists, market participants buying at a discount could absorb the supply from spot traders, particularly as selling pressure intensifies.
A drop before a move upward?
On the chart, POL is expected to experience a minor drop before resuming its upward movement, despite being in a bullish symmetrical triangle on the 1-hour chart. This drop is likely due to selling pressure from spot traders.
Is your portfolio green? Check out the POL Profit Calculator
The price is expected to reverse once it reaches the support level of 0.5478. However, if selling orders are filled quickly, it could drop further to 0.5347, from where it would continue its upward momentum, potentially gaining 14.56% and reaching a target of 0.6127.


Source: TradingView
After hitting this level, the asset may continue to trend upward, especially if the overall market sentiment remains bullish and sustained buying activity from derivative traders.

