- After a 300% price rise last month, XLM’s value dropped last week.
- Buying pressure increased, but there were chances of a bearish crossover.
After a month of massive price hikes, Stellar [XLM] bears took back control. However, despite this, multiple bullish patterns had appeared on the token’s price chart. In case of a successful breakout, XLM might eye $0.90 next.
Stellar’s new bull patterns
XLM showcased incredible performance in the last 30 days, outperforming most top cryptos. To be precise, the token’s price surged by more than 300% during that time.
However, the trend changed in the last seven days as the taken witnessed a slight 3% price drop. At the time of writing, XLM was trading at $0.4879.
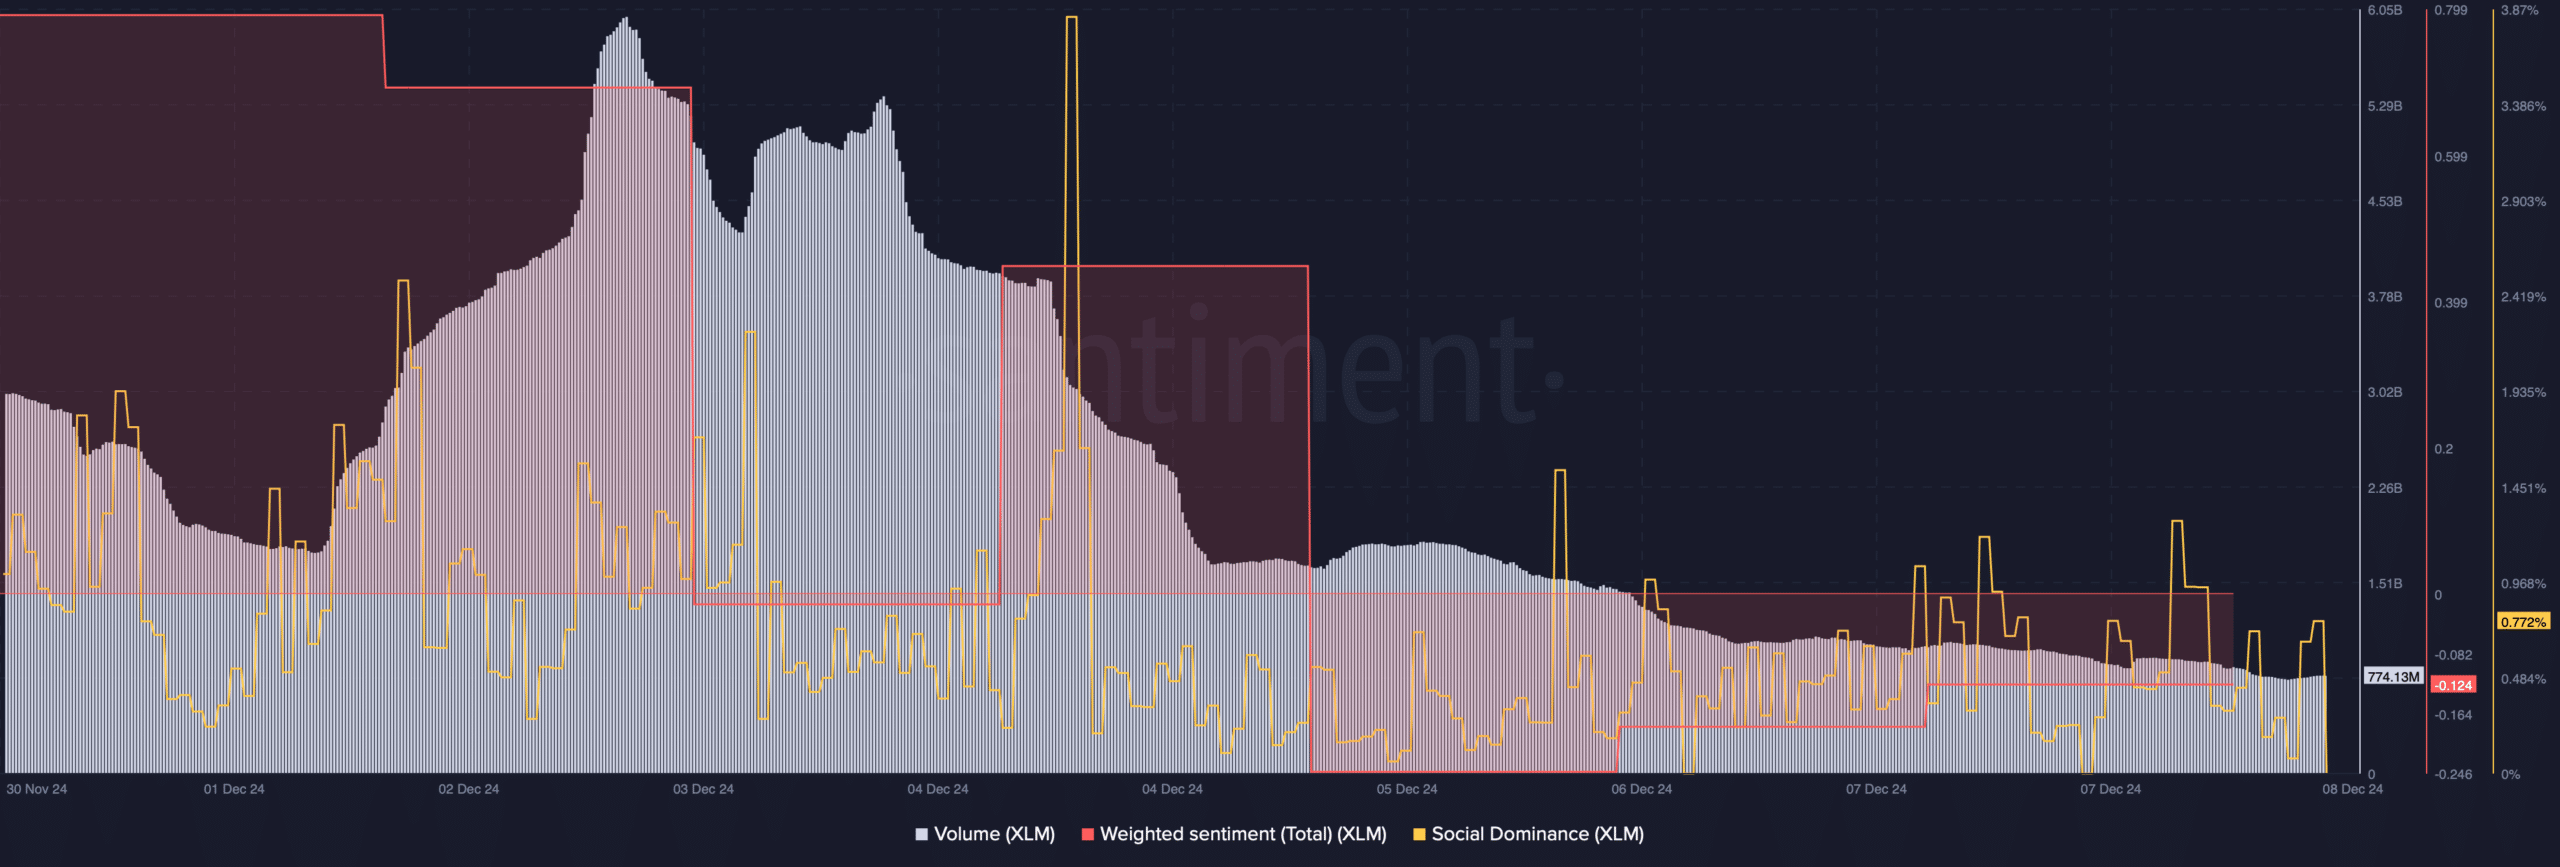
The latest price decline had a negative impact on Stellar’s social metrics. For instance, XLM’s Social Dominance declined, which hinted at a decline in the token’s popularity.
Its Weighted Sentiment also plummeted—a clear sign of rising bearish sentiment. Nonetheless, Stellar’s trading volume declined sharply, along with its price. This meant that there were chances of a bullish trend reversal.

Source: Santiment
In fact, Javon Marks, a popular crypto analyst, recently posted a tweet revealing two bullish patterns that appeared on Stellar’s charts. The first one was a bullish symmetrical triangle pattern that formed in November.
XLM’s price was consolidating inside the pattern and at press time, it was on its way to approach the resistance of the pattern.
The second falling wedge pattern formed on the token’s Relative Strength Index (RSI) chart. Thankfully, the RSI broke above the bullish pattern.
If XLM’s price follows a similar trend and manages a breakout, the token might move towards $0.90 in the coming days.


Source: X
Will XLM breakout soon?
Hyblock Capital’s data revealed that while XLM’s price fell victim to a correction, investors bought the dip. The token’s buy volume increased on a couple of occasions in the past few days.
Whenever the metric rises, it indicates that there is more buying activity happening in the market for a particular token.


Source: Hyblock Capital
However, not everything was in the token’s favor. For instance, the long/short ratio registered a sharp decline.
This meant that there were more short positions in the market, which generally indicates less confidence among investors in an asset.
Read Stellar’s [XLM] Price Prediction 2024–2025
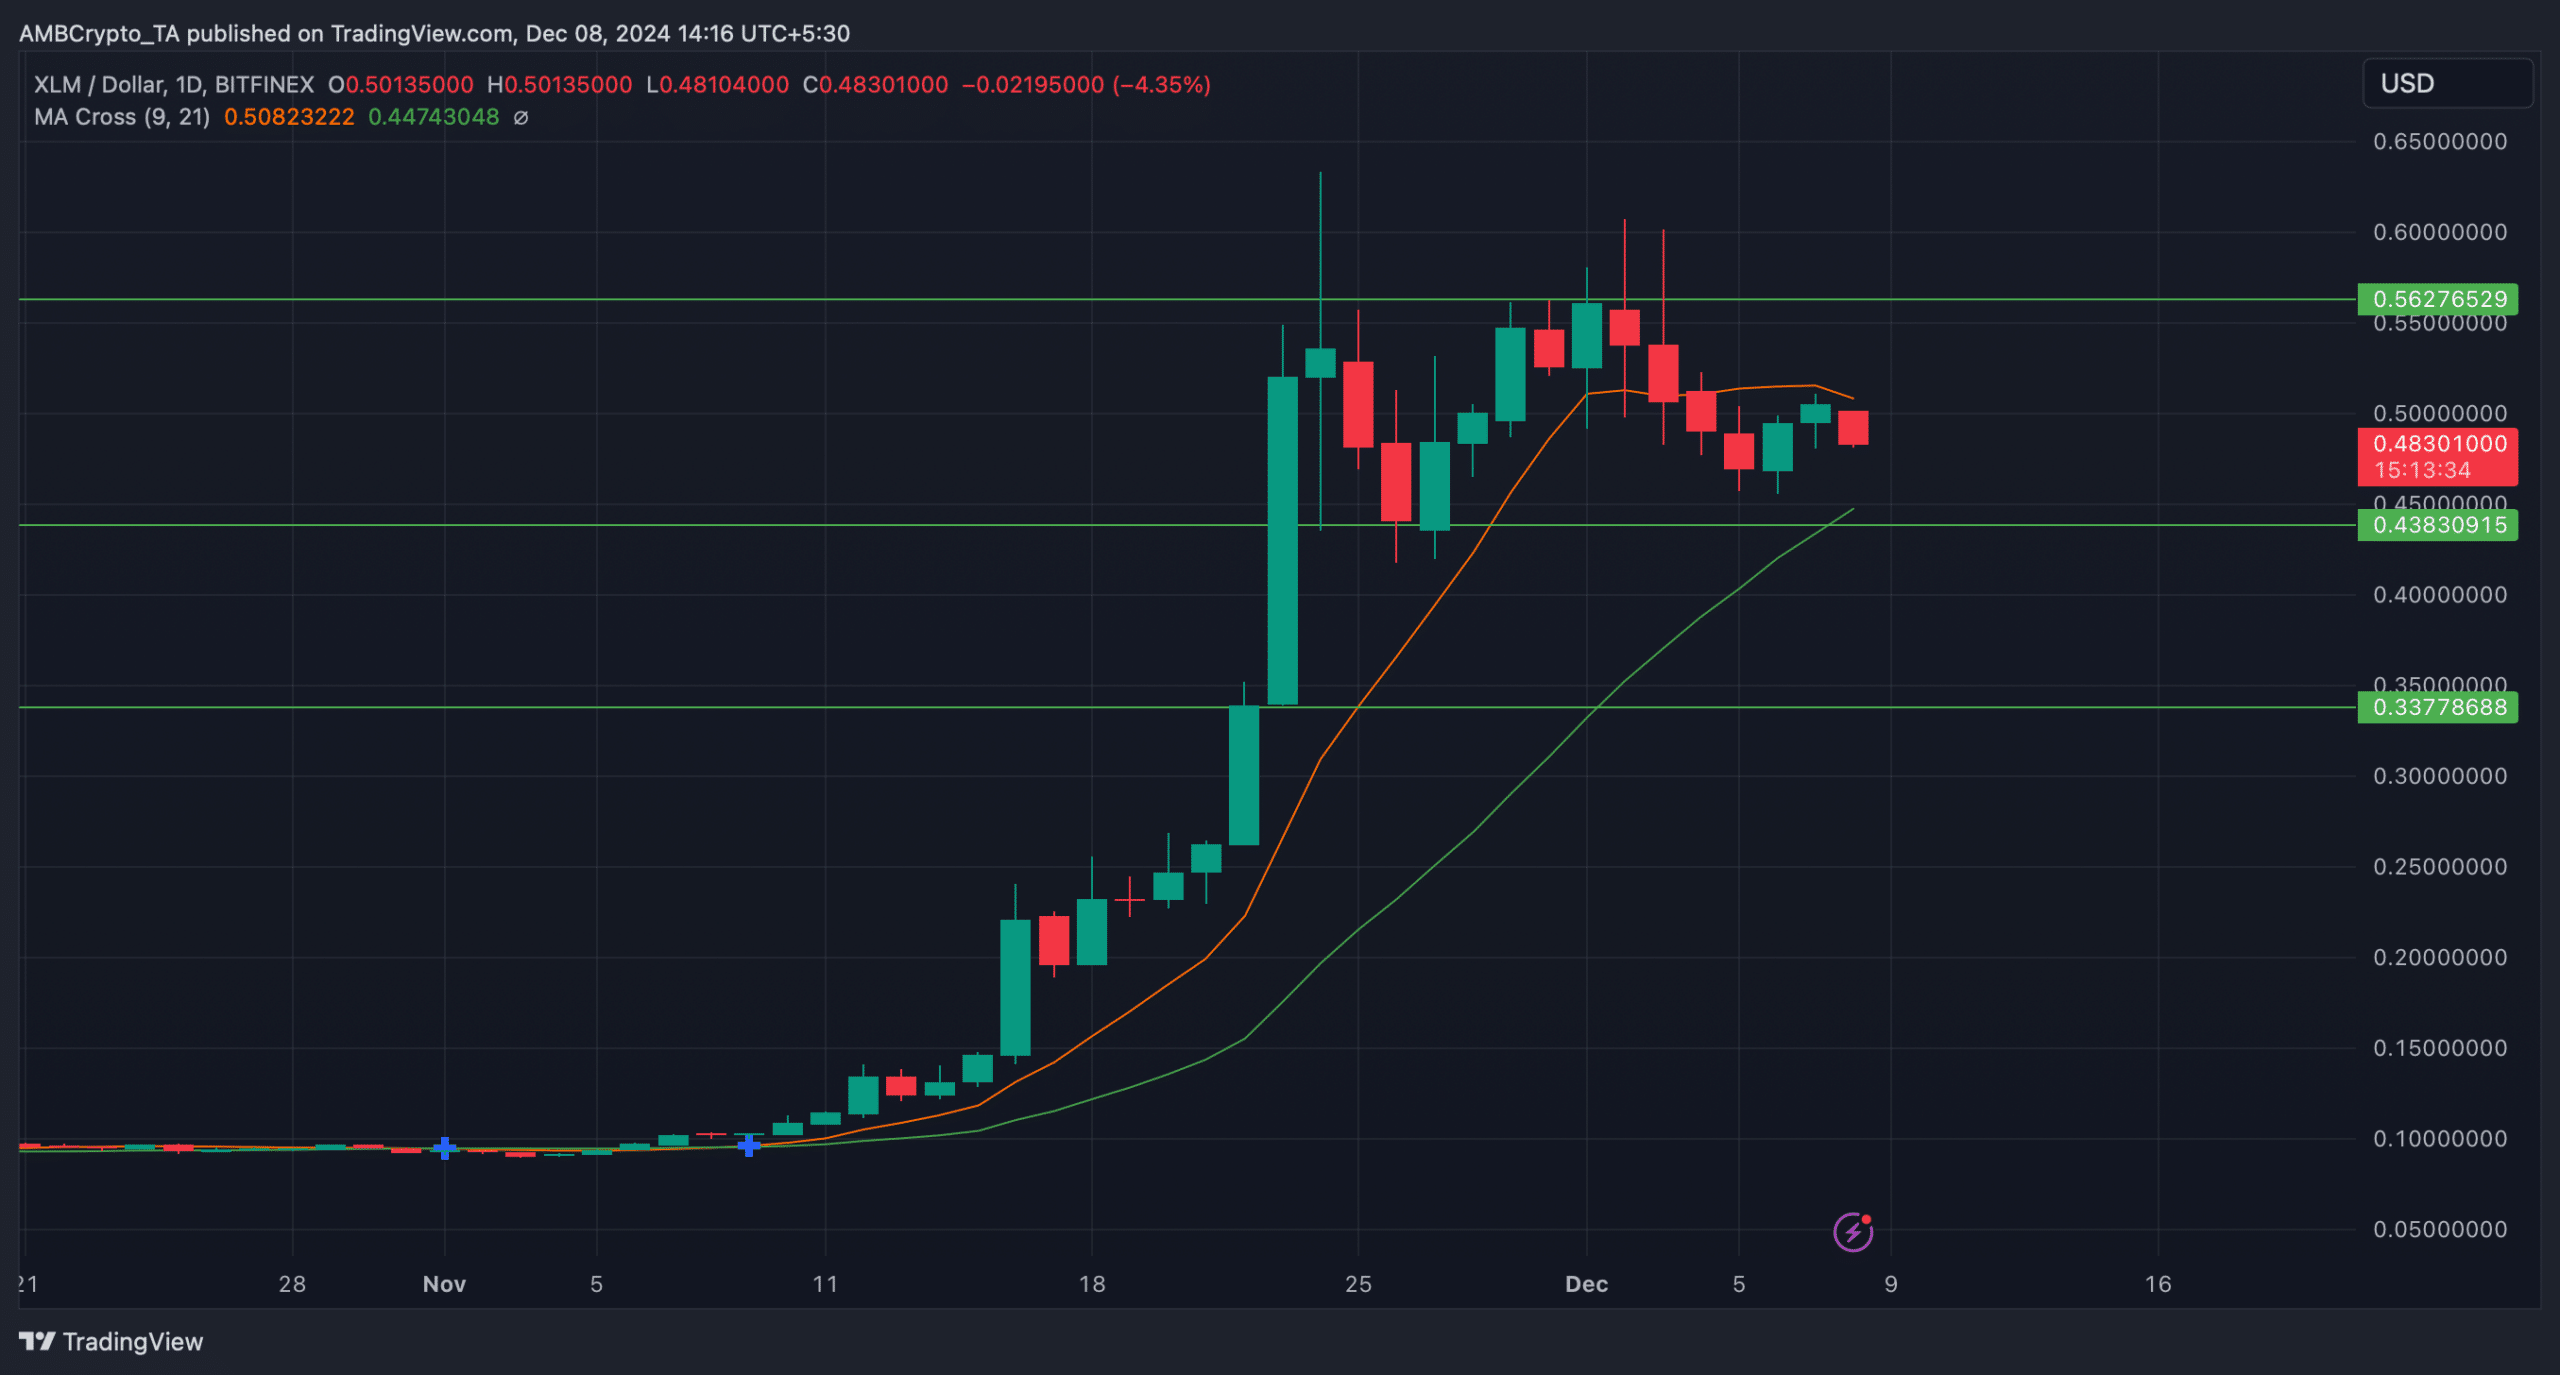
The MA Cross indicators displayed the possibility of a bearish crossover, as the distance between the 21-day MA and the 9-day MA was reducing.
If XLM continued to drop, then its price might find support at $0.43. Nonetheless, in case of a bullish trend reversal, it will be crucial for Stellar to cross the $0.56 resistance in order to sustain the rally.


Source: TradingView

