- Solana long liquidations soared to $57 million on 10th December, causing a rise in selling activity.
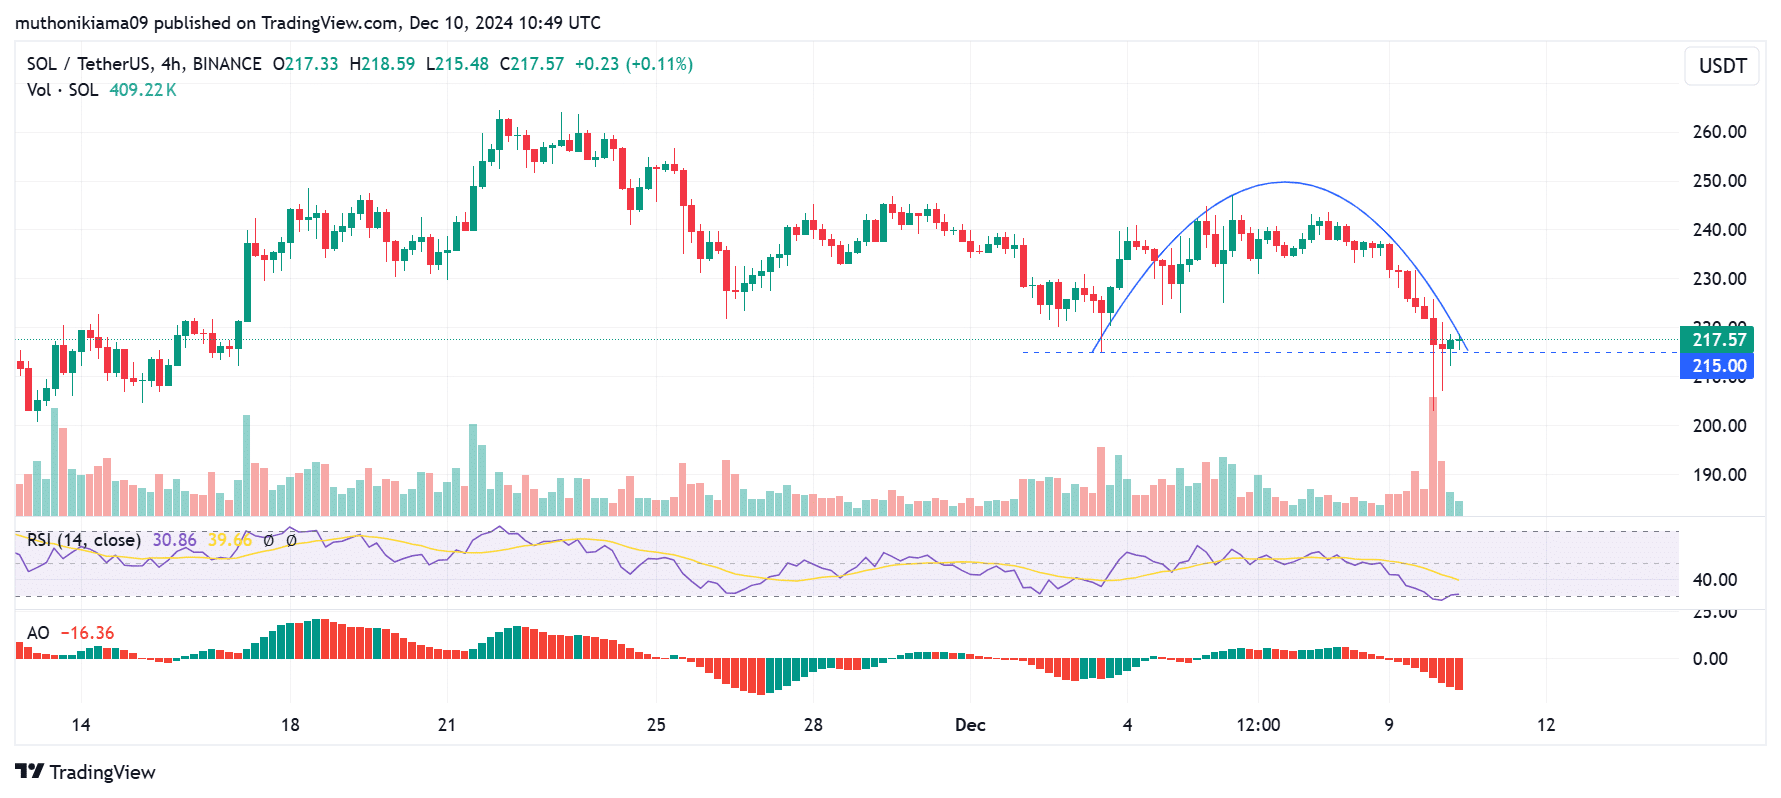
- A rounded top pattern on Solana’s four-hour chart suggests a bearish continuation.
Solana [SOL] has succumbed to the bearish sentiment across the broader cryptocurrency market after a 5.39% drop in 24 hours to trade at $217 at press time. Its market capitalization also briefly dropped below $100 billion for the first time in three weeks.
The heightened volatility witnessed in the last 24 hours comes amid a surge in liquidations in the derivatives market, with Solana bulls registering massive losses.
Solana long liquidations hit record highs
Data from Coinglass showed that on 10th December, the total liquidations for leveraged long positions on Solana reached $57 million. This marked the highest volume of SOL long liquidations in over five months.

Source: Coinglass
Long liquidations tend to increase selling activity, causing Solana to drop. However, this cascade of liquidations might have wiped out the overleverage around Solana, giving the altcoin room to recover.
On the other hand, there are still other liquidation clusters below the current price. If Solana fails to recover from the current bearish trends, and the price hits these levels, it could cause further declines.
Rounded top shows a bearish trend
Solana has also formed a rounded top pattern on its lower timeframe chart suggesting that bears were in control. The neckline of this rounded top pattern stands at $215, a level that SOL has tested severally.
If Solana fails to hold this support and drops, it could ignite a drop below $200 to $183, triggering more long liquidations.


Source: Tradingview
The Relative Strength Index (RSI) has a value of 30 suggesting that SOL is leaning towards being oversold. While this could stir some gains, a sustained uptrend will happen if the RSI line crosses above the signal line.
The Awesome Oscillator (AO) further highlights the bearish momentum because of the red histogram bars, which confirm that SOL is in a downtrend.
Will SOL drop further?
These bearish indicators show that SOL is poised for more dips if there is no shift in buyer sentiment.
Read Solana’s [SOL] Price Prediction 2024–2025
Traders should watch out for a drop below the neckline of the rounded top at $215, as that could accelerate the downtrend. Moreover, a drop below $200 could cause more pain for buyers due to long liquidations.


Source: Coinglass
Solana’s liquidation map on Coinglass shows that the long liquidation leverage for SOL below $200 is significantly high, and if these positions are forcibly closed, it could cause further declines.

