- Golden cross confirmed long-term strength on the altcoin’s chart
- Exchange outflows spiked while daily active addresses surged
The Virtuals Protocol (VIRTUAL) is navigating a critical market phase right now. Especially as the price tests significant Fibonacci support levels, while on-chain metrics highlighted increasing network engagement despite recent price volatility.
Needless to say, the token’s trajectory has grabbed market attention as network fundamentals strengthened amid price consolidation.
VIRTUAL Fibonacci levels signal critical support test
VIRTUAL’s price action hit a decisive point at $2.846, coinciding with the 0.5 Fibonacci retracement level at $2.638. Furthermore, the token recorded a 14.17% decline, with the press time trading volume touching 483.7K VIRTUAL and indicating significant market interest at these levels.
Notably, at the time of writing, the 50-day moving average at $2.836 remained comfortably above the 200-day MA at $0.82711. This allowed the altcoin to maintain a bullish market structure, despite recent bouts of corrections.
Source: TradingView
Network activity shows resilience
Meanwhile, VIRTUAL’s daily active addresses demonstrated remarkable growth, with recent data revealing sustained user engagement throughout the consolidation phase. The metric also saw a spike earlier this month, with the crypto consistently maintaining elevated levels throughout.
This trend hinted at growing adoption, regardless of price fluctuations. Such a divergence between VIRTUAL’s price action and network activity has historically preceded significant market movements.
Exchange flow dynamics signal accumulation
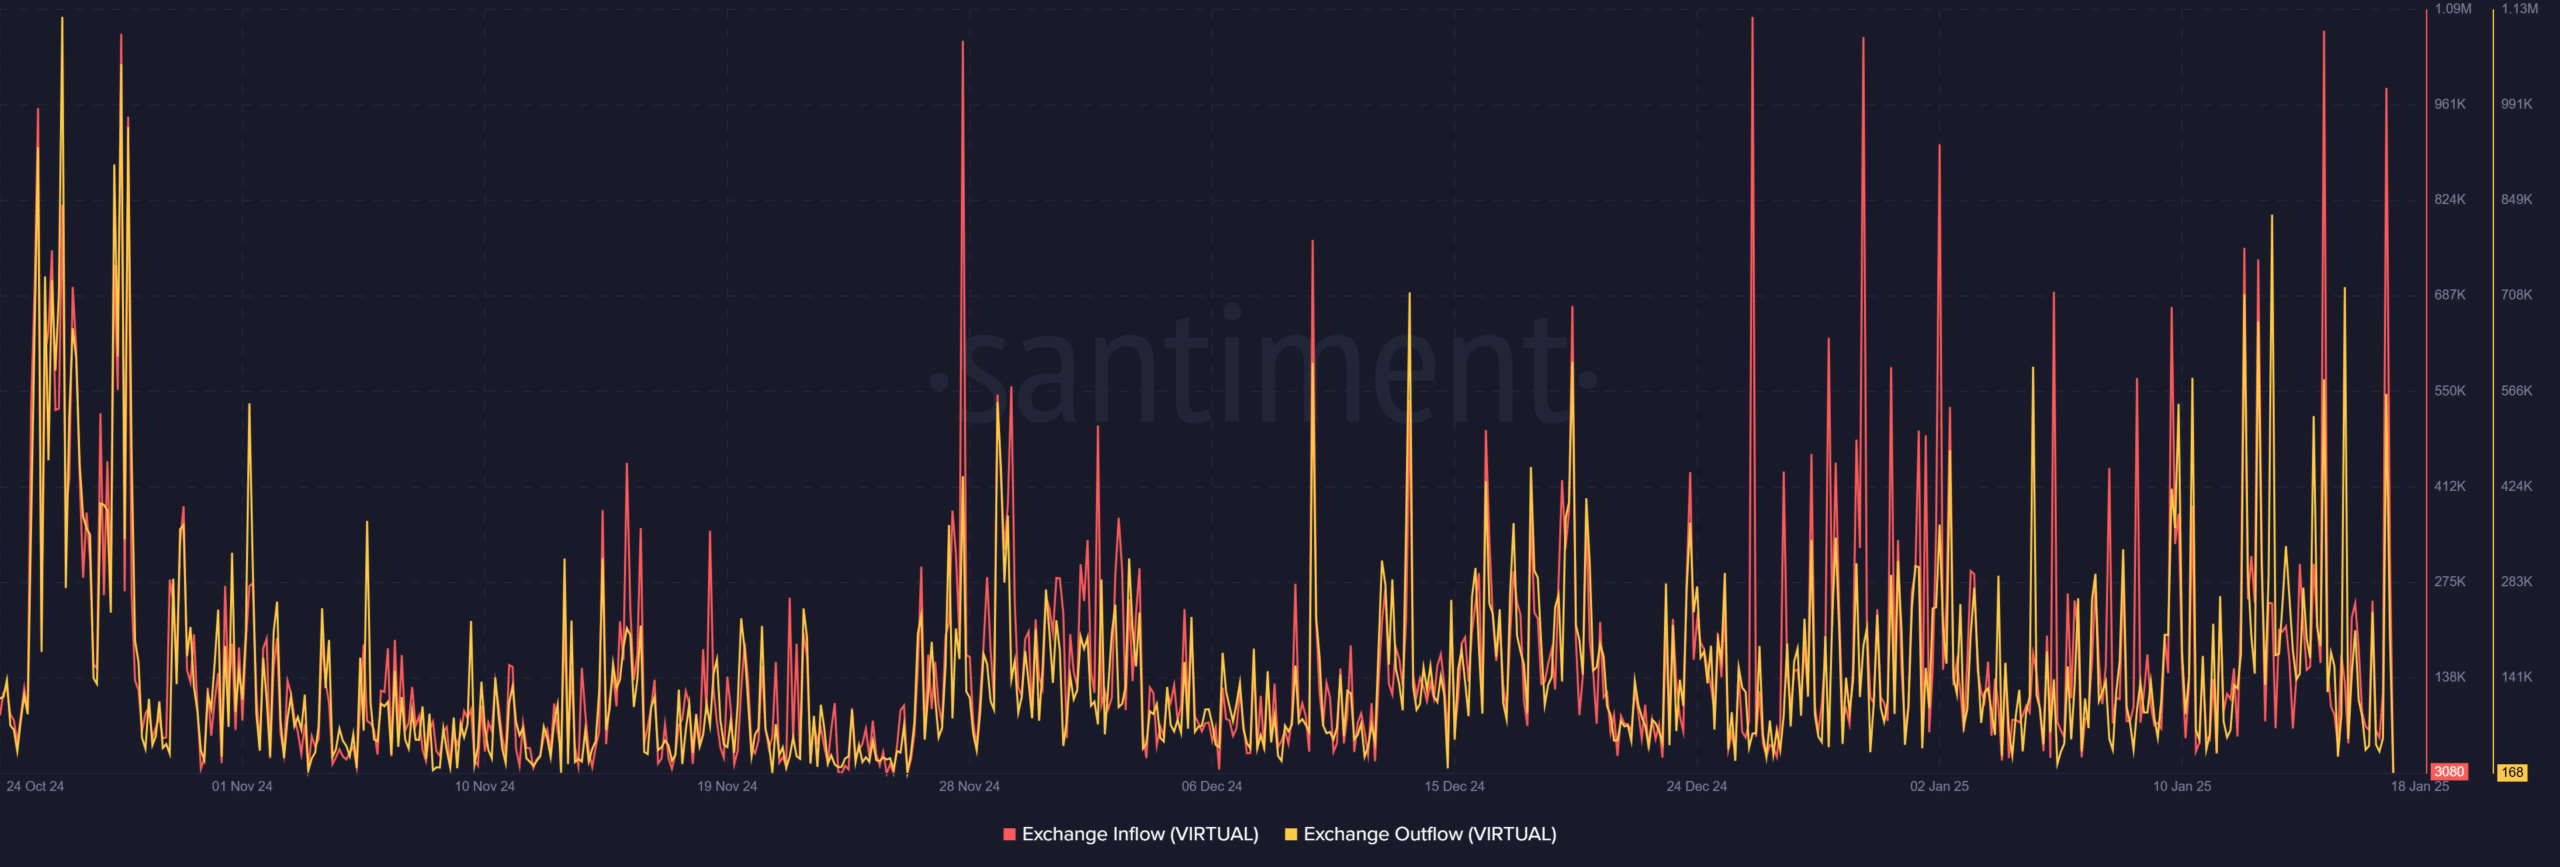
Additionally, VIRTUAL’s exchange flow metrics revealed sophisticated market behavior. Outflow spikes have become increasingly frequent since December, pointing to strategic accumulation by larger players during price dips.
Consequently, inflow patterns displayed controlled distribution rather than panic selling – A sign of mature market participation and growing confidence in VIRTUAL’s ecosystem.

Source: Santiment
VIRTUAL’s technical structure highlights market maturity
The golden cross formed by VIRTUAL’s moving averages, with the 50-day at $2.836 maintaining position above the 200-day at $0.827, underlined the underlying strength in the longer-term trend. Moreover, the Fibonacci retracement levels from its recent high provided some crucial insights too, with the immediate resistance at $4.017 and strong support established at $2.022.
Recent exchange flow patterns further confirmed VIRTUAL’s maturing market structure. The synchronization of strategic outflows and measured inflows hinted at institutional-grade positioning, rather than retail-driven volatility.
This behavior and consistently increasing daily active addresses, together, point to strengthening network fundamentals despite price fluctuations.
– Is your portfolio green? Check out the Virtuals Protocol Profit Calculator
VIRTUAL’s immediate challenge lies in maintaining support above the 0.5 Fibonacci level at $2.638. A successful defense of this zone, supported by growing network metrics, could signal the end of the ongoing correction phase.
The convergence of technical support with increasing network activity presents a compelling case for market stability at press time levels. What this means is that VIRTUAL’s market structure is maturing and capable of supporting sustained growth.

