- PEPE has been trading within a symmetrical triangle pattern
- Market data revealed a potential slide lower before gaining massive momentum to drive the price higher
PEPE has managed to maintain a steady negative range over the past weeks of trading, dropping significantly on the daily, weekly, and monthly charts. In fact, analysis revealed that the fall could slightly extend lower, before seeing a major push upwards.
The path to a rally still remains intact though, should the key support level act as the base.
Drop to support level remains strong
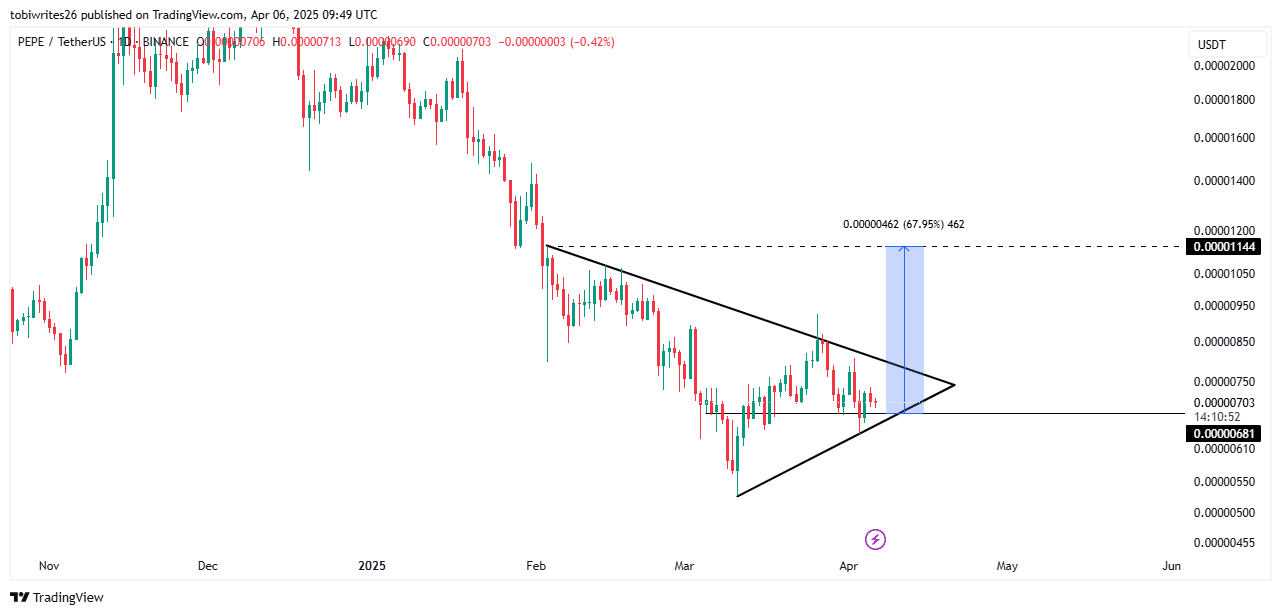
At the time of writing, PEPE was trading within a bullish pattern known as the symmetrical triangle, made up of converging support and resistance lines, with price oscillating within it—known as accumulation.
Typically, from this pattern, a major rally would follow, running higher. By analysis, it could see a price jump of 65%, reaching $0.00001144. However, the rally isn’t yet fulfilled. First of all, to achieve this jump, there needs to be a decline to a support level of $0.00000681, from which the price boom could continue upwards.

Source: TradingView
AMBCrypto’s analysis also revealed that the push to the support level lower is likely, based on key indicators in the market that highlighted the presence of downward pressure.
Key indicators in the market point lower
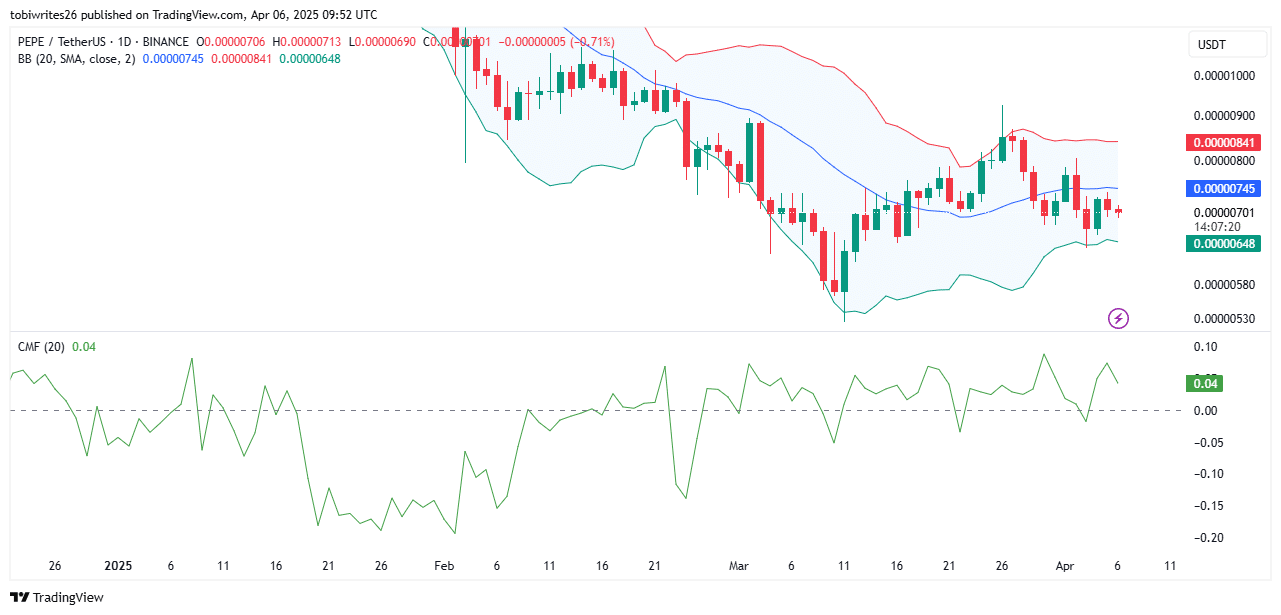
According to technical indicators in the market, the Bollinger Bands and Chaikin Money Flow underlined the potential for a likely drop.
The Bollinger Bands, which use three bands—upper, middle, and lower—to determine possible market direction, pointed to the asset just trading into the middle band. This has often acted as resistance, pushing the price lower.


Source: TradingView
Similarly, the Chaikin Money Flow, which records accumulation or distribution in the market, suggested that there’s a current distribution phase. However, the market still remained in the positive zone, with a reading of 0.4.
This southbound move within the positive region implied that PEPE’s drop is likely going to be minimal and could see a major turnaround at the support level on the chart – Not far from its press time price position.
Spot market remains a key driver
Spot traders in the market have also been contributing to the fall towards the support level, as they’ve been selling. In line with the previous analysis, the fall could likely coincide with the support level marked on the chart.
Spot traders have sold about $2.78 million worth of PEPE in the market, driving the fall lower. However, with the market reaction being slow, it is a sign of deliberate accumulation. And, the price could see a massive rebound to the upside.


Source: Coinglass
Overall, the market potential for a rally still remains intact, provided the direction of key indicators remains unchanged.

