
contributor
Posted:
- XLM’s recent price action showed a potential to continue its bullish momentum, especially if it can close above the 200-day EMA.
- The long/short ratio on top crypto exchanges showed a slight edge for bulls.
Stellar [XLM] recently rebounded from its long-term support near the $0.08 zone, helping the bulls reclaim key moving averages on the daily chart.
This move helped XLM surge by around 12% over the last few days. At press time, XLM was trading at $0.0982.
With the 20-day and 50-day EMAs converging and looking north, the bulls have an excellent opportunity to reclaim their momentum.
Are bulls looking to topple the $0.1 resistance?
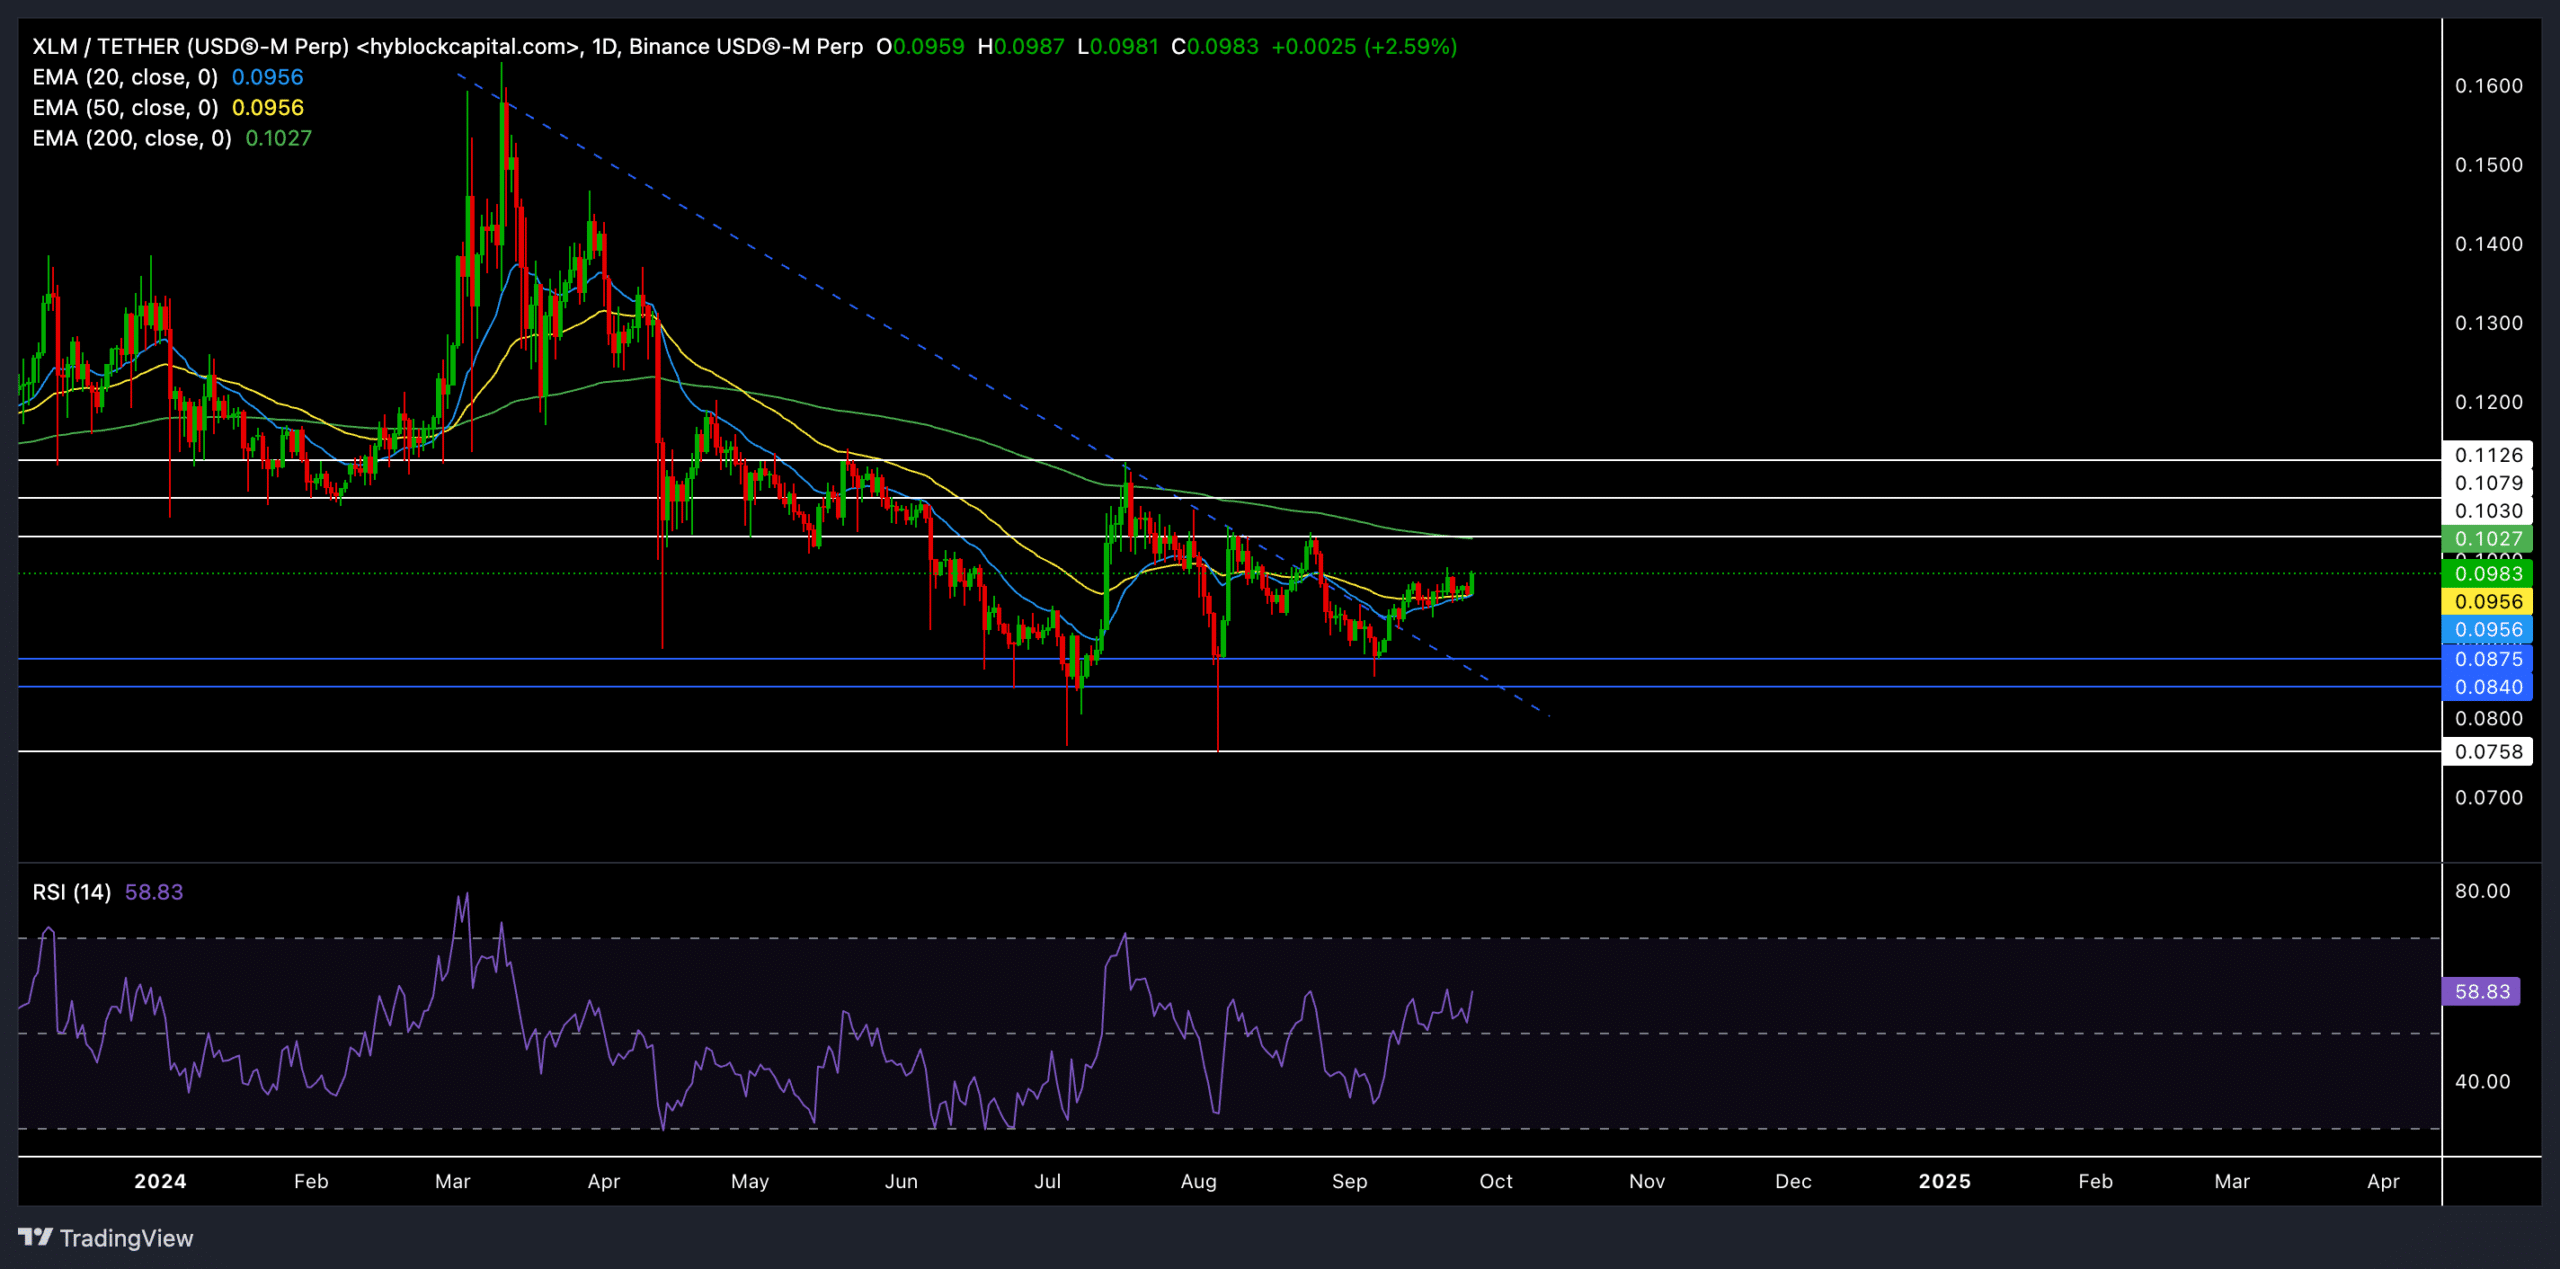
Source: TradingView XLM/USDT
XLM is currently above both the 20-day and 50-day EMAs, which stood at $0.0956.
If the 20-day EMA finds a comfortable close above the 50-day EMA and the moving averages keep looking north, XLM could challenge its 200-day EMA at $0.1027.
If a breakout above this level occurs, the next immediate target would be the $0.103 resistance, followed by the $0.1126 zone.
It’s worth mentioning that XLM also jumped above its long-term trendline resistance (dashed blue line) and flipped it to support amid the recent rally.
The RSI also steadily climbed to 59.15 to show an increasing bullish edge. However, the recent lower highs on the price action showed a somewhat bearish divergence.
As a result, we could see a bearish move in the near term before a revival.
If the broader crypto market turns bearish or XLM fails to break above the 200-day EMA, the altcoin could revisit the $0.08 support.
In this scenario, the price action would show a descending triangle-like structure. Failure to hold the $0.08 level could result in a deeper pullback toward the $0.075 level.
Derivates data revealed THIS

Source: Coinglass
XLM’s volume spiked by over 36% to $45.44 million in the last 24 hours, showing a relatively high trading activity. The open interest for XLM also increased by 3.17%.
The long/short ratio on Binance was at 2.0075, with more traders currently opting for long positions. Similarly, OKX’s long/short ratio of 1.6 also reflected buyer interest. This showed bullish sentiment across major exchanges.
Investors should closely watch the $0.08 support zone and the $0.103 resistance. A strong breakout above the latter could open doors to test the higher levels.
Read Stellar’s [XLM] Price Prediction 2024–2025
However, failure to maintain current levels could confirm a bearish pattern on the daily chart.
Moreover, it’s crucial to consider Bitcoin’s movement and the overall macroeconomic sentiment before making any buying decisions.
Disclaimer: The information presented does not constitute financial, investment, trading, or other types of advice and is solely the writer’s opinion