
- AVAX’s instability caused many long liquidations.
- If the price hit $58.23, another decline might occur.
It was not good news for traders who opened long Avalanche [AVAX] positions on the 27th of March. According to data from Coinglass, contracts valued at $316,200 were wiped out in the last 24 hours.
Out of these positions, longs accounted for $277,890 while short liquidations stood at $38,310. Liquidation occurs when an exchange forcefully closes a trader’s position.
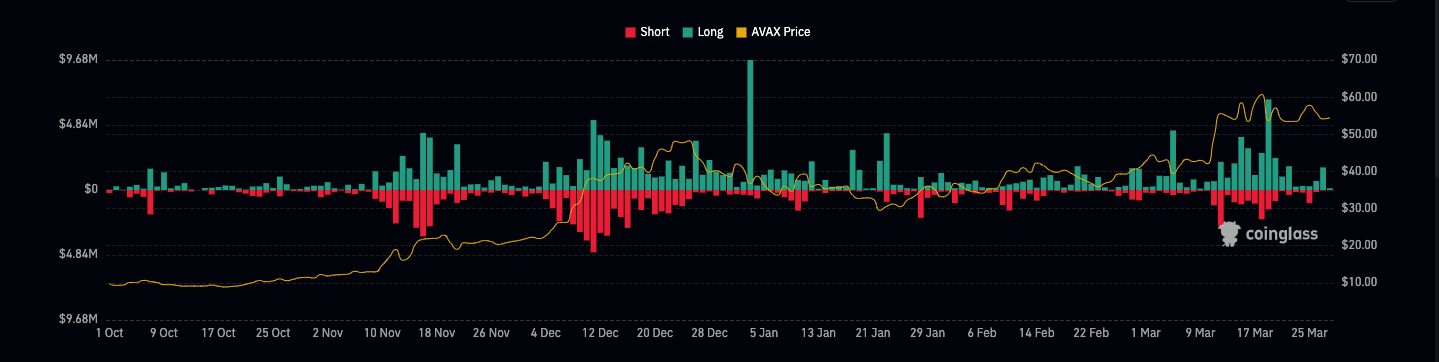
Source: Coinglass
This happens when the trader does not have the minimum collateral to keep the position open. Other times, the market moving in the opposite direction to the predicted one could trigger it.
Quick swings are bad
For AVAX, a large part of the extermination could be linked to its price action. At press time, AVAX changed hands at $54.60. But on the 27th of March, the price almost reached $55 before volatility hit the market and it retraced to $53.81 in less than two hours.
Furthermore, AMBCrypto evaluated the Long/Short Ratio. The metric indicates if investors have a positive or negative expectation about an asset’s price.
If the value is over 1, then the sentiment is largely positive and traders are expecting a price increase. However, values less than 1 indicate a negative sentiment.
At press time, AVAX’s Long/Short Ratio was 0.95, indicating that the average sentiment was bearish.
When we looked at the metric further, we discovered that only 8% of traders were very bullish on the cryptocurrency. However, a whopping 33% were betting on the price to decrease. The rest were either neutral, slightly bullish, or bearish.
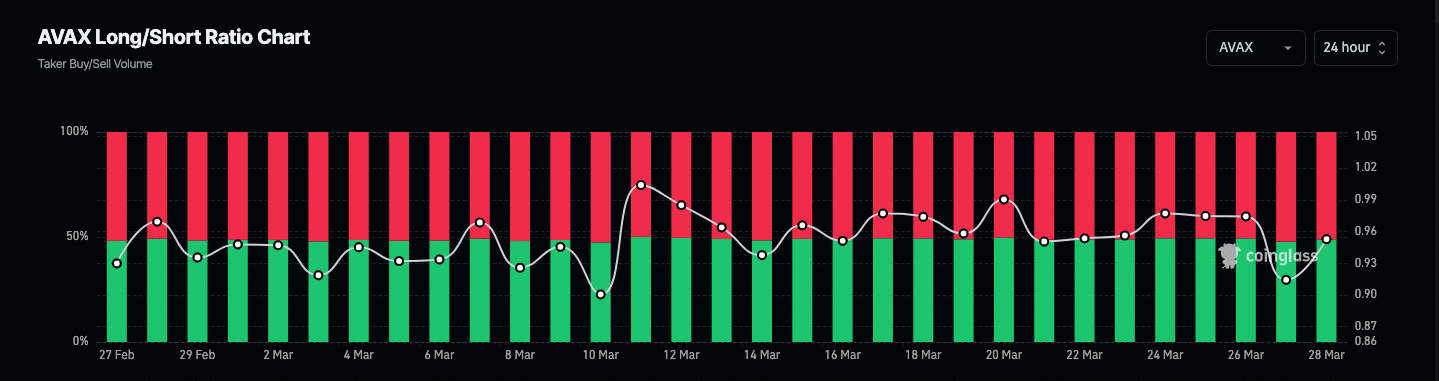
Source: Coinglass
In addition, AMBCrypto analyzed AVAX’s Cumulative Volume Delta (CVD). Typically, the CVD is used to assess traders’ aggression in the market.
At press time, the spot CVD had formed a lower low as the reading was negative. Though CVD does not paint the full picture, the decline implied that perp sellers have become more aggressive.
If the indicator continues to remain negative while the token tries to hit a higher price, longs might not be rewarded. From the technical angle, the 20 EMA (blue) and 50 EMA (yellow) were around the same spot.
Entries appear below $54
This indicates that the price trend was neutral. Also, AVAX has slipped below both EMAs, suggesting that the trend had more chance to be bearish than bullish.
If buying pressure increase, then the token might climb. But the Supertrend flashed a sell signal at $58.23. Therefore, if AVAX rises that high, a pushback might occur.
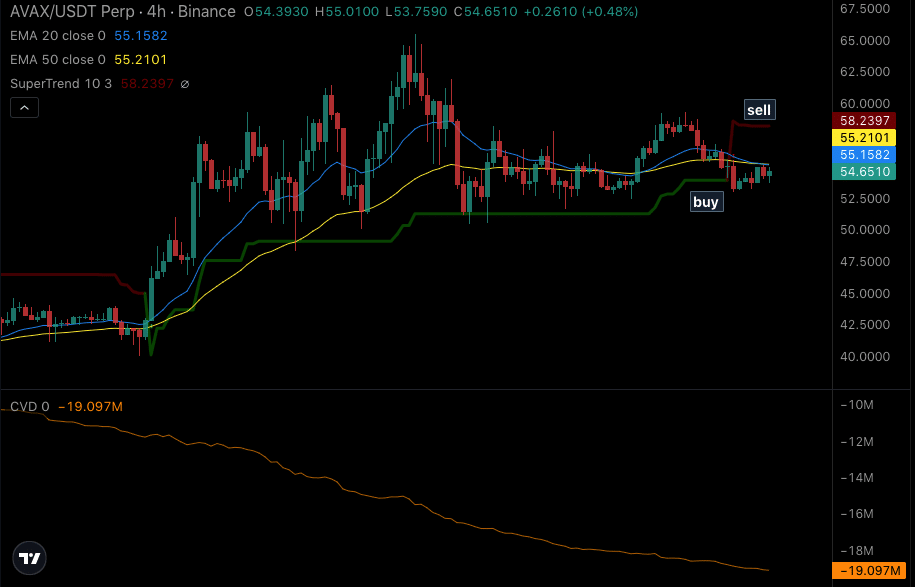
Source: Coinalyze
Is your portfolio green? Check the AVAX Profit Calculator
Conversely, there was a buy signal at $53.96. If the price declines to this point, then it could be a good entry to open a long position.
Regardless of its short-term potential, the token remains one that could perform well this cycle. A major reason for this prediction is the buzzing Real World Assets (RWAs) narrative in which Avalanche’s fundamentals lie.