- A currently under-threat streak of daily gains has catapulted BNX price near its 22nd August high.
- BNX stands to benefit from a recovering Bitcoin whose price action remains influential to smaller cap alts.
The crypto market has been a whirlwind of activity marked by modest gains across the board, recovering trading volumes, and a feeling of suspense among traders.
CoinMarketCap data showed that the total crypto market capital has grown by 3.2% in the last 24 hours and currently stands at $2.02 trillion. The 24-hour trading has, on the other hand, swollen by 26.40% during this period.
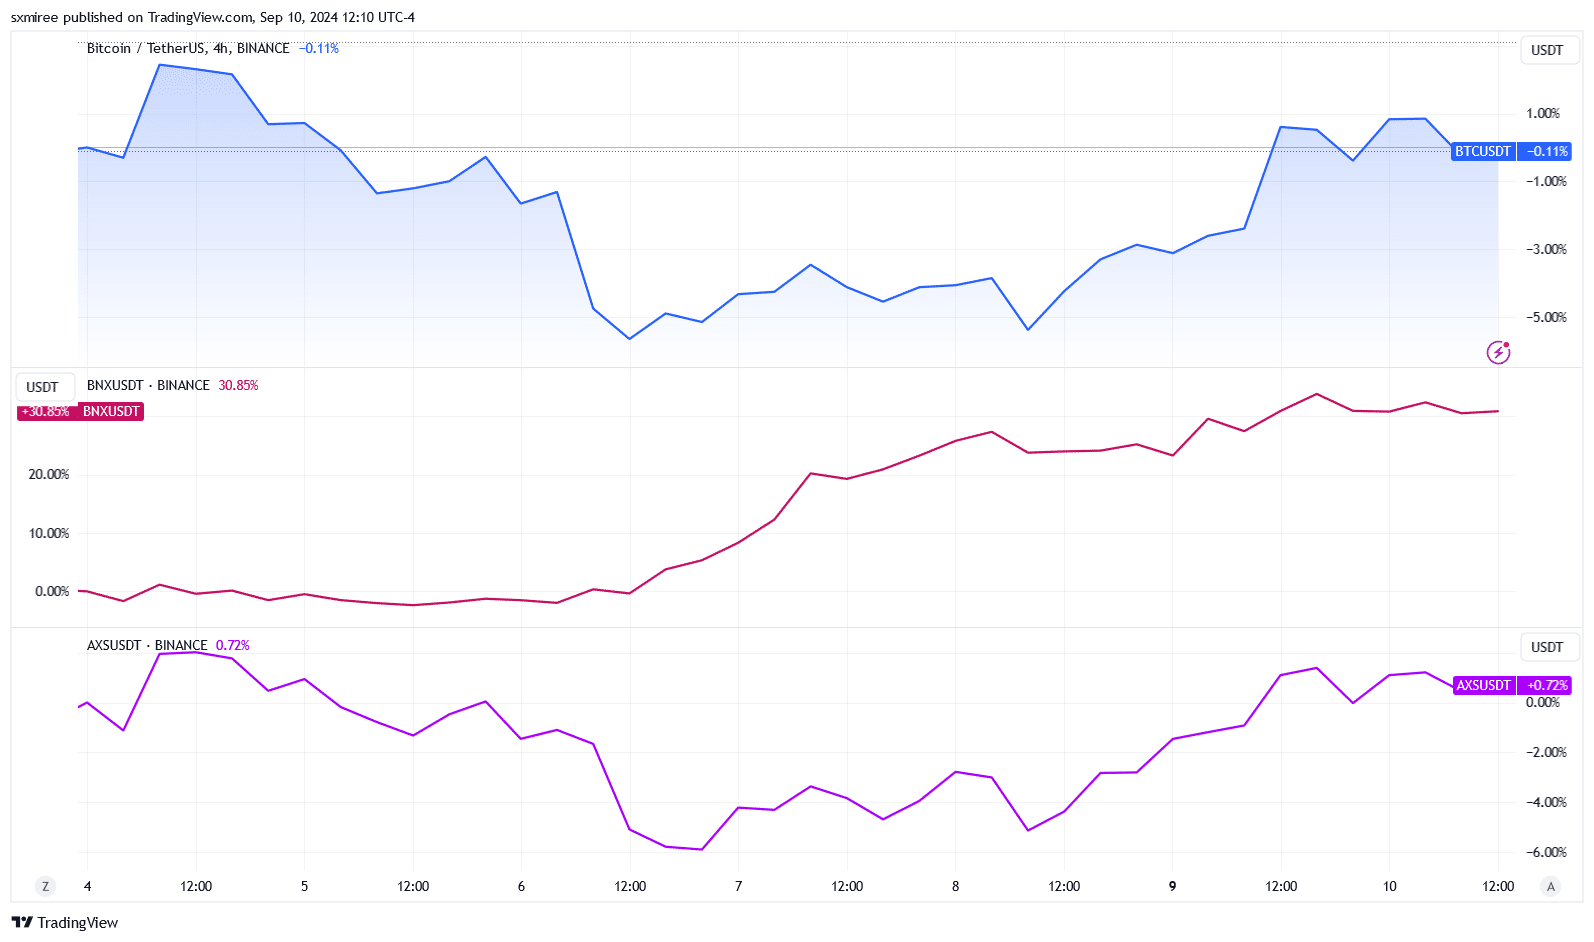
Bitcoin, the leading cryptocurrency by market capital, retook $57K earlier on 10th September, but remains 3% in the red this month.
In contrast, Binary X’s GameFi token BNX has stood as one of the top performers capturing the attention of speculators thanks to a noteworthy continuous daily uptrend in the last four days.

Source: TradingView
BNX was trading at an impressive gain of 30% in the last 7 days, leading gaming tokens, including Axie Infinity (AXS), Sandbox (SAND), Gala (GALA), and Decentraland (MANA) during this period.
Binary X price prediction shows…
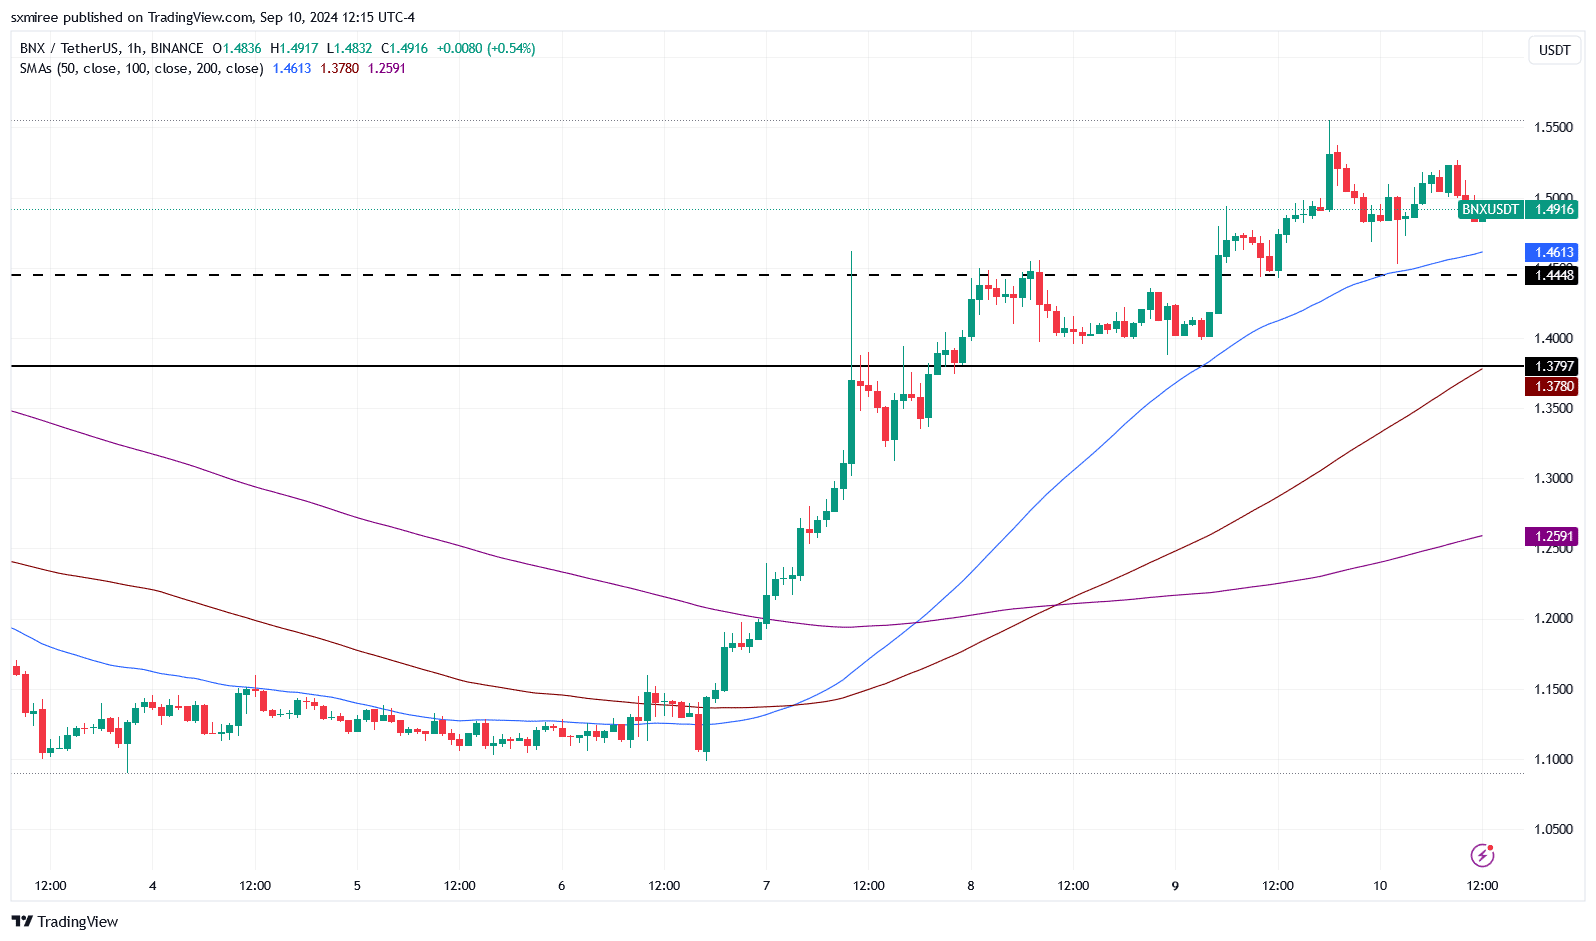
TradingView’s BNX/USDT hourly chart shows BNX flipped resistance at $1.37 to support on 7th September before accelerating to take out the $1.44 ceiling, where it was previously rejected.
BNX continued its remarkable hike on Monday, the 9th of September, printing a fourth successive green candle.


Source: TradingView
BNX was changing hands at $1.49, at the time of writing. Sustained consolidation above $1.37 will reinforce the bulls’ resolve to challenge the stiff resistance near $1.7, where the BNX price was rejected twice in August.
BNX must overcome this resistance at $1.66 to seek a new yearly high on uncharted grounds above $1.84.

Source: TradingView
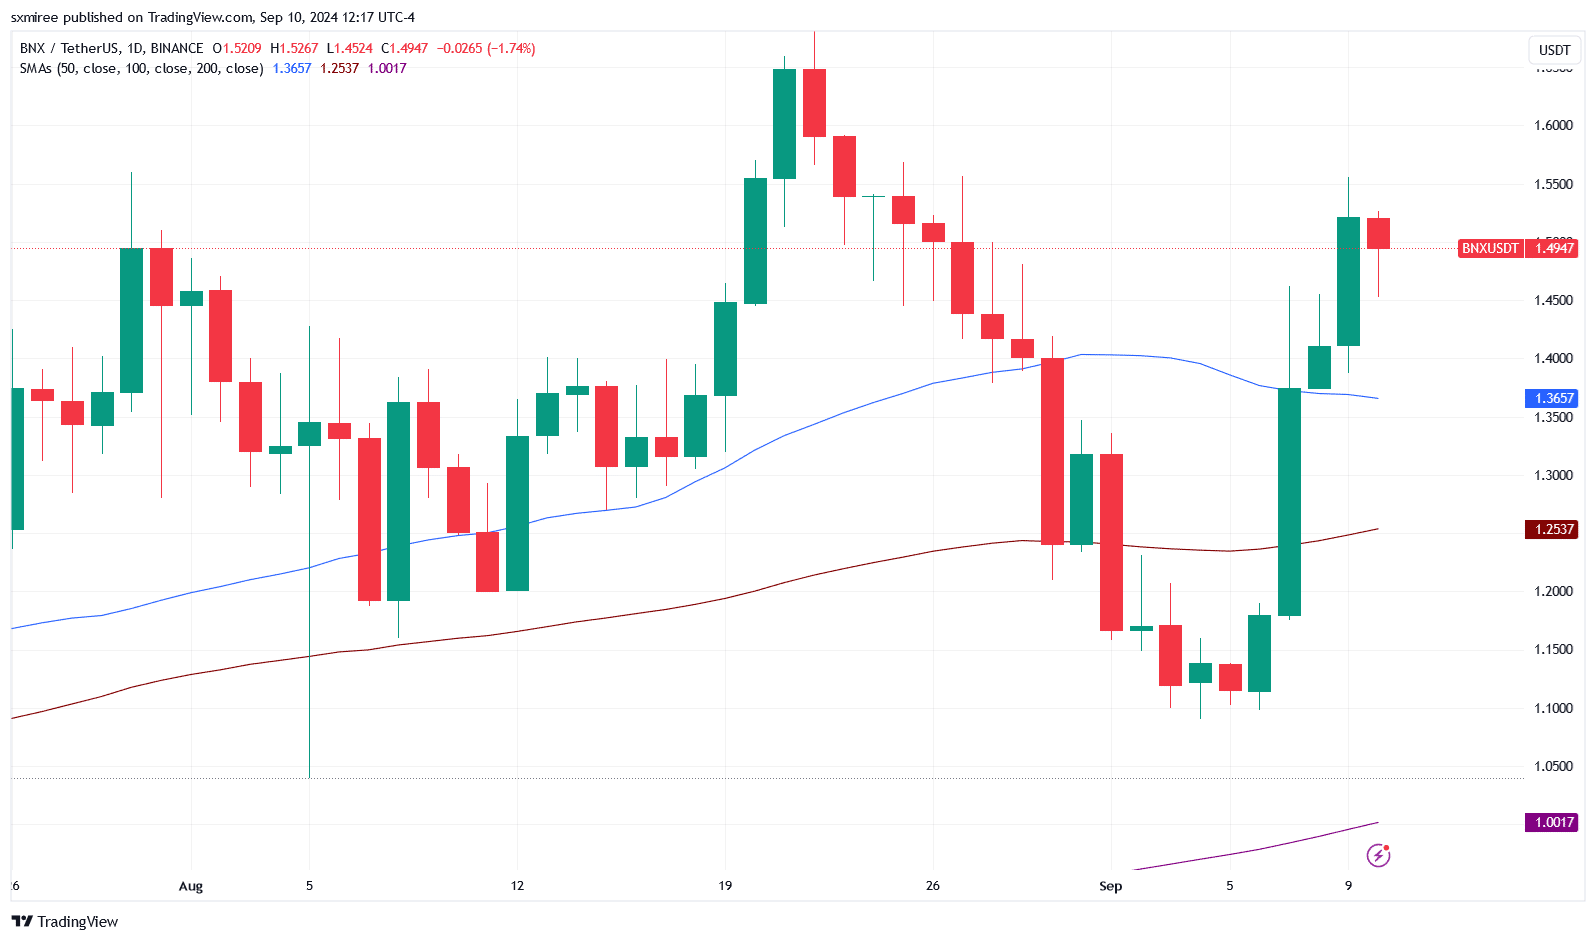
Conversely, a correction will bring into picture the support level at $1.38. A breakdown below this immediate support will trigger further retracement towards the stronger support around the 200-day moving average at $1.00.
Profit-taking and downside risks
On the daily chart, BNX was showing signs of price weakness after the striking bullish breakout from an initial dip, which pushed the token below $1.12 on 7th September.
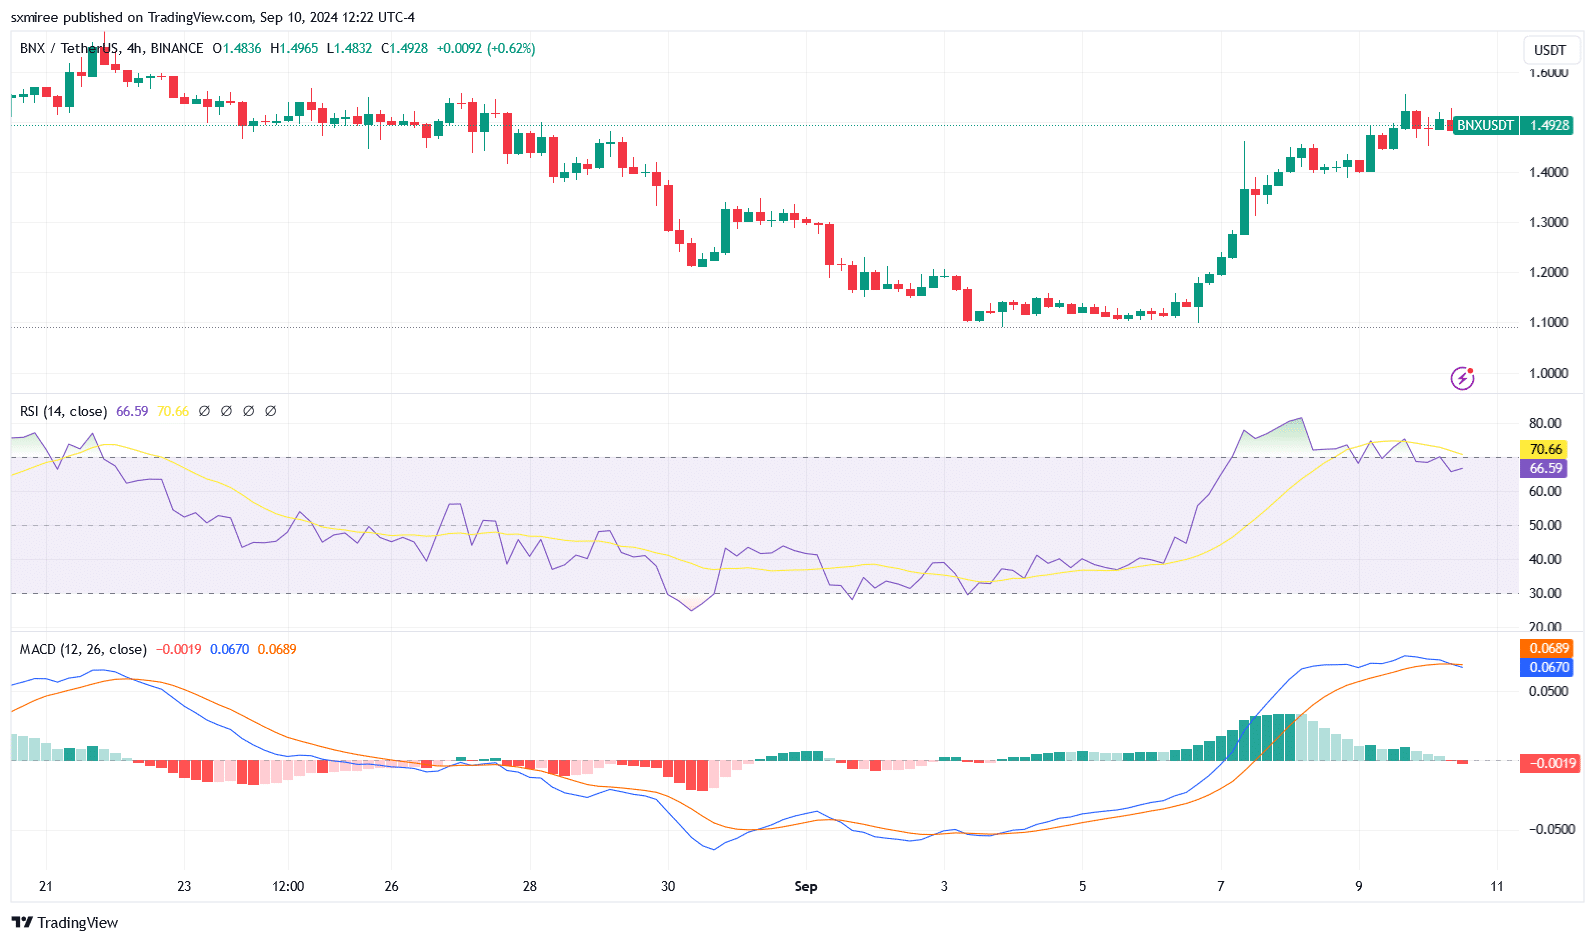
The Relative Strength Index (RSI) and MACD (Moving Average Convergence Divergence) indicators on the BNX/USDT 4-hour chart similarly signal a shift a potential shift to bearish momentum.

Source: TradingView
The RSI reading has been ranging outside the overbought zone above 70 and was hovering just under 67 at writing. Meanwhile, the MACD line is approaching the signal line from above forming a bearish crossover, which suggests an impending price downtrend.
This bearish outlook could compel traders to take profits, mounting selling pressure at the current range.
In addition, a lack of immediate sustaining catalysts could attract short positions from bearish speculators as bullish counterparts focus on tightening stop-losses on their long positions.

