- Cardano’s on-chain metrics showed a buy signal.
- A short-term uptrend could be established, with the $0.43 resistance zone as a take-profit zone.
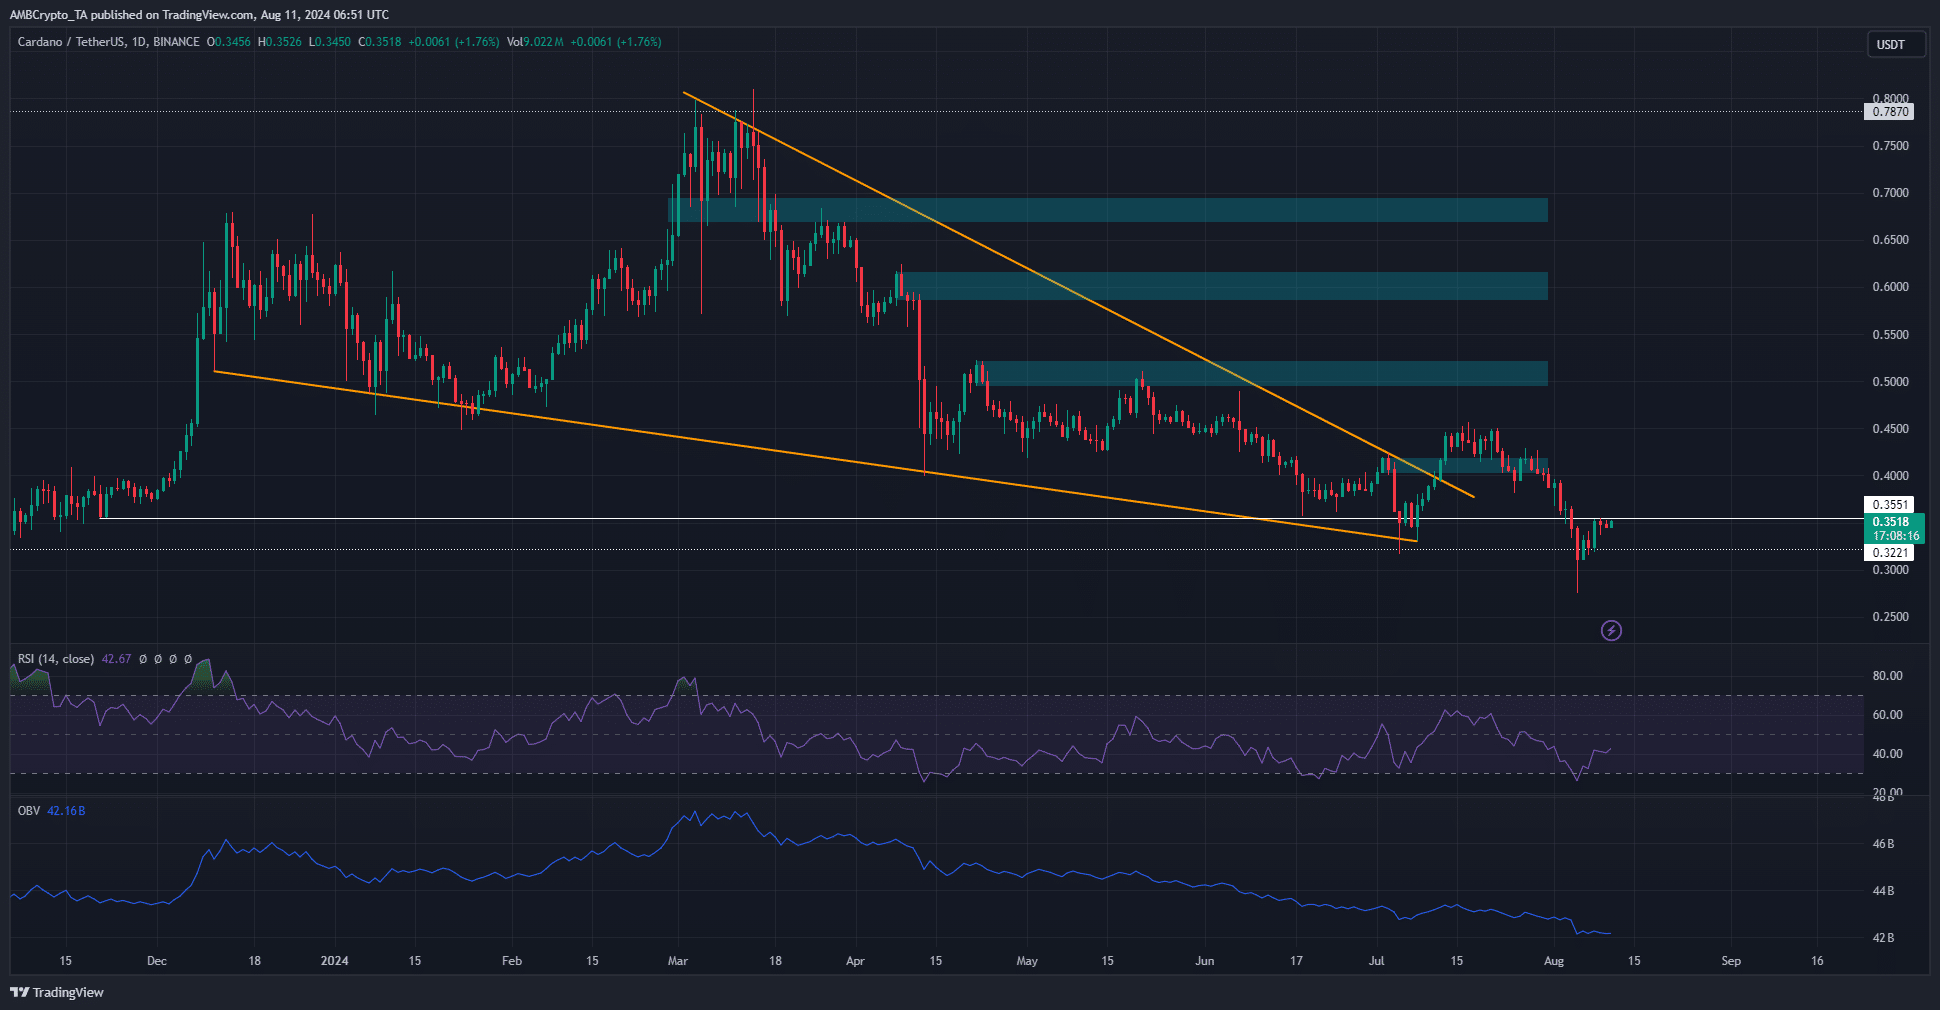
Cardano [ADA] was in a downtrend on the daily timeframe and was trading just beneath the resistance level at $0.355. The technical indicators showcased a bearish trend as well.
AMBCrypto’s analysis of on-chain metrics revealed a more hopeful picture for the bulls. Will the recovery come about in August, or will long-term holders have to wait many more weeks?
Cardano was trying to set a higher low

Source: ADA/USDT on TradingView
The OBV has been flat over the past few days after the heavy drop in the first week of August. This showed that buying volume has not established superiority yet. The daily RSI was at 40 and the momentum remained bearish.
Together, they showed that the bias was bearish. The price action revealed the same, but there is some hope for the bulls Since the drop below $0.3, ADA has slowly pushed higher.
Over the next few weeks, it could form a bullish lower timeframe structure and set a series of higher lows and higher highs if it can breach the $0.355 resistance. Yet, in the daily timeframe, the recent lower high at $0.429 remains the level to beat.
Network activity sparks more hope


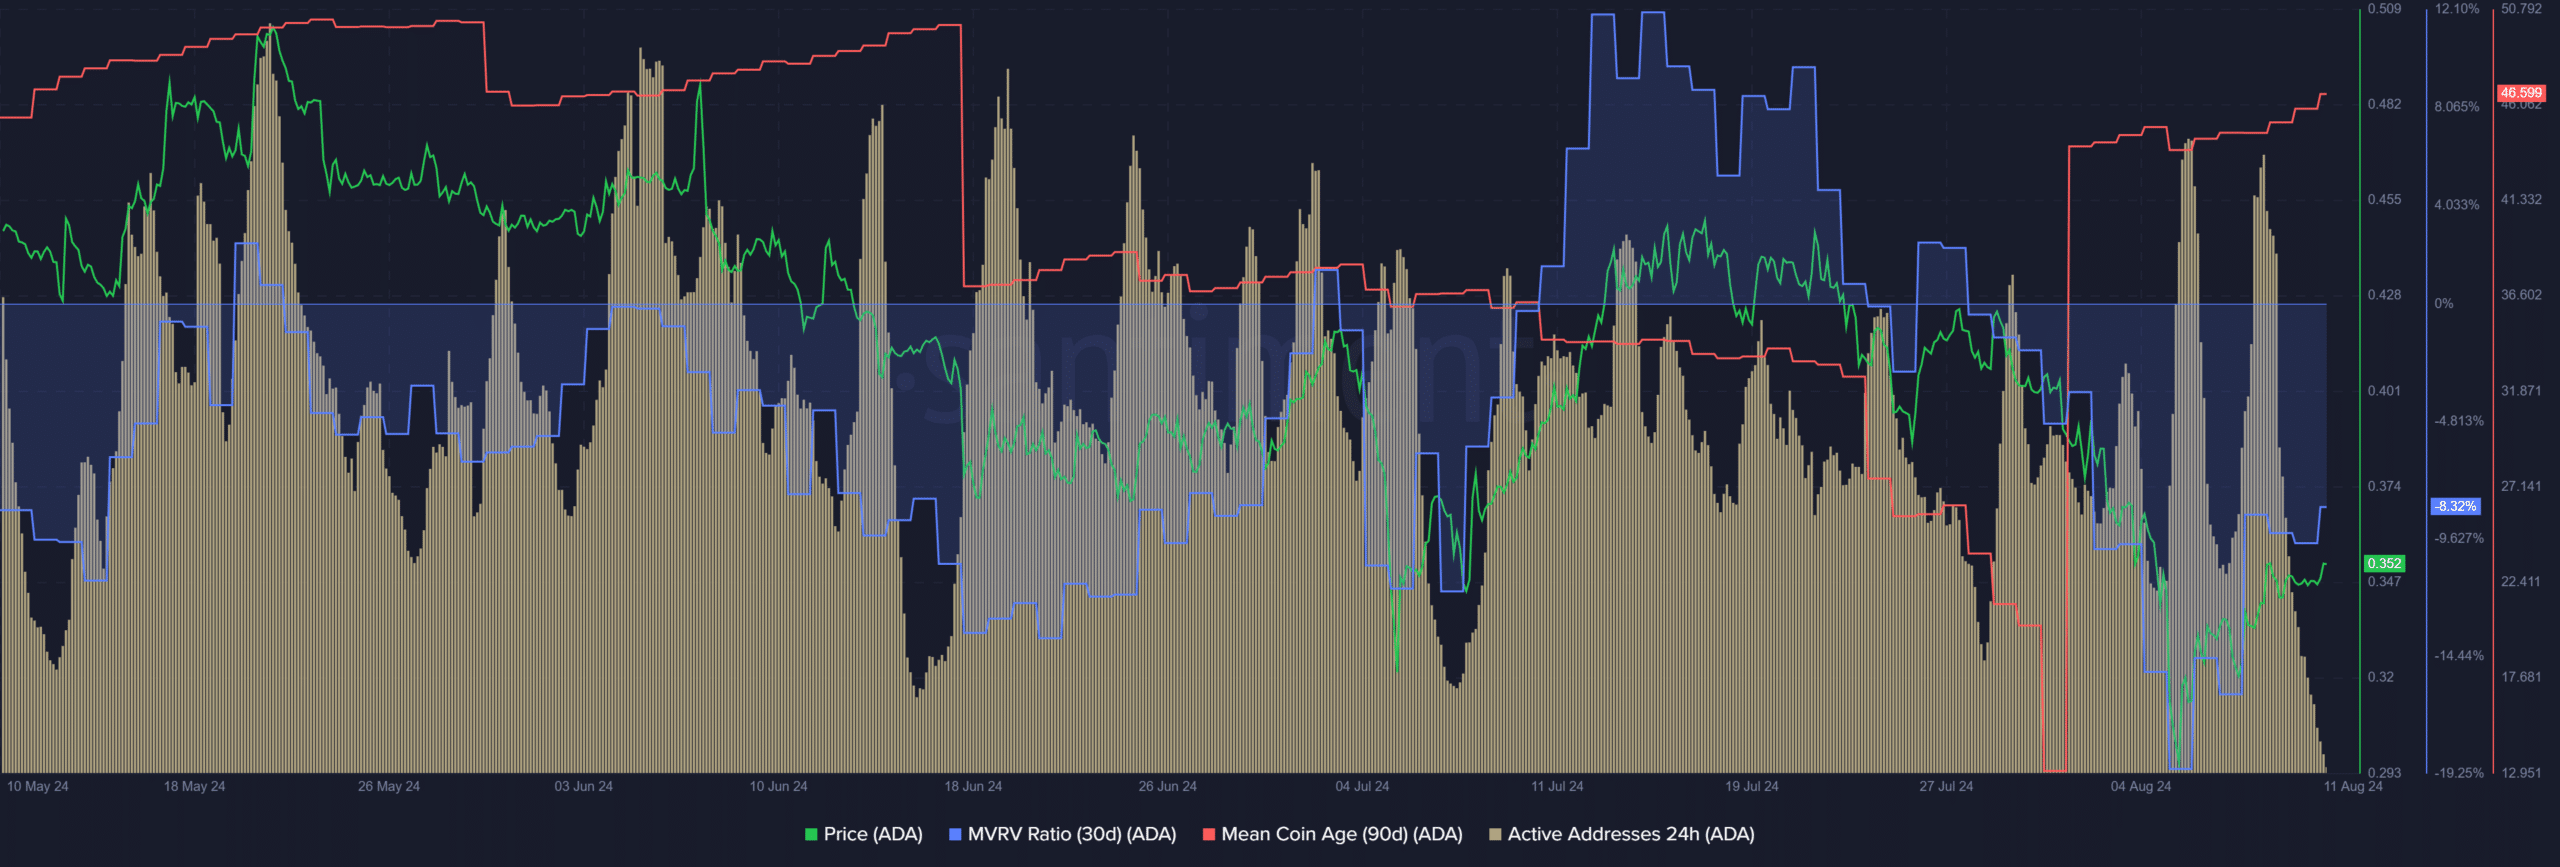
Source: Santiment
The 30-day MVRV was negative but the mean coin age has begun to trend higher. This was a buy signal which showed that ADA was undervalued but was also being accumulated.
Read Cardano’s [ADA] Price Prediction 2024-25
The daily active addresses metric climbed higher compared to mid-July. The activity spike on the 5th of August might have been from panic selling. Another was seen on the 8th of August when prices were climbing.
If the activity continues to post similar numbers, it would be a signal of increased speculation and demand for the token.
Disclaimer: The information presented does not constitute financial, investment, trading, or other types of advice and is solely the writer’s opinion

