- Grayscale continued to have the largest market share in ETH spot ETFs.
- Buying pressure was rising, and a metric suggested that ETH was undervalued.
Ethereum [ETH] ETFs have showcased commendable performance over the past few days. In fact, its netflows have once again reached a new high, reflecting high adoption and investors’ trust. Despite this, ETH has been struggling to cross the $4k barrier.
Ethereum ETFs set a new record
Lookonchain’s recent tweet pointed out that in the past month, nine Ethereum ETFs have accelerated their holdings of ETH, totaling 362,474 ETH, which were worth over $1.42 billion.
This marked a 4,363% increase compared to the previous month, during which only 8,121 ETH, worth over $31.8 million, were added.
The better news was that the ETH ETFs inflows reached a high. As per Coinglass data, ETH ETF netflows have been on the rise for the past few weeks. On the 5th of December, netflows hit a whopping $428.5 million, setting a new record.

Source: Coinglass
Mentioning the market share, Grayscale ETF had the largest market share of 47%, as per Dune Analytics’ data.
Grayscale was followed by Grayscale Mini and BlackRock, which had 13% and 12%, respectively. While Grayscale’s holdings touched $5.8 billion, BlackRock’s holdings stood at $2.9 billion.
ETH’s struggle continues
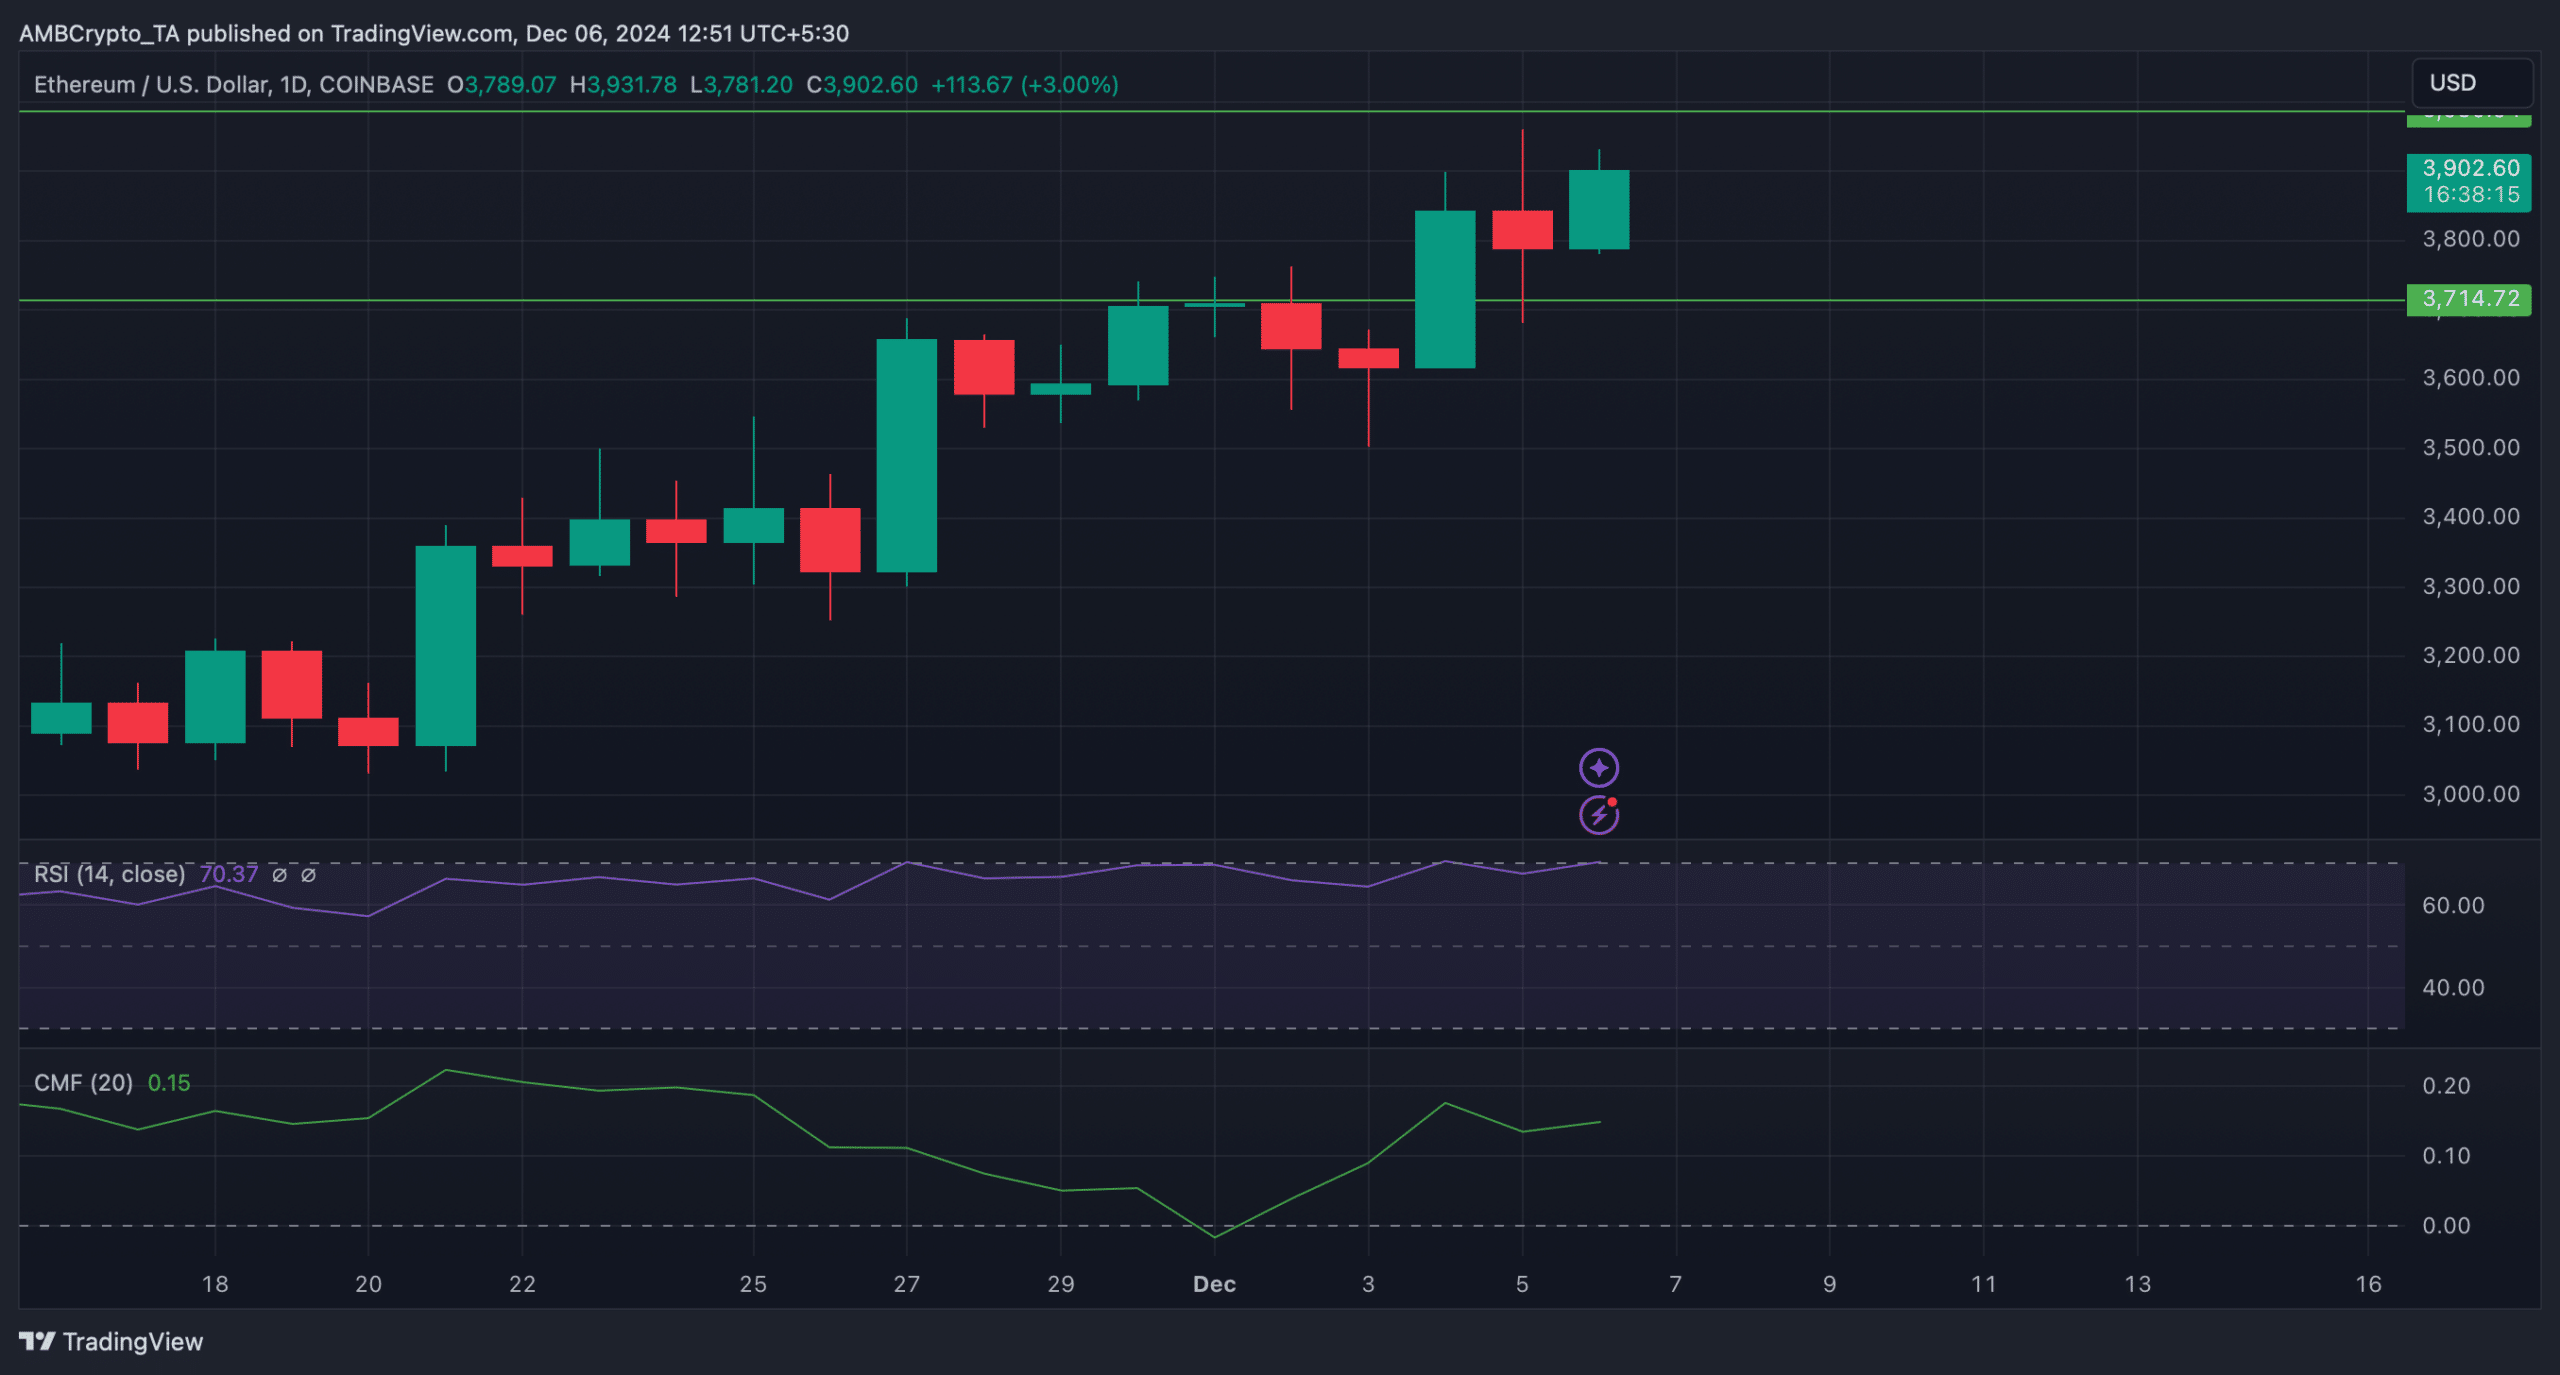
While Ethereum ETFs set a new record, ETH was getting rejected on multiple occasions near the $4k resistance. At press time, the king of altcoins was trading at $3,912.25 with a modest 1.3% price rise in the past 24 hours.
Though the token was struggling to breach a barrier, the Ethereum Rainbow Chart suggested investors remain patient. As per the chart, ETH price was in the HOLD zone, meaning that the chances of the token marching upward in the coming days are high.


Source: Coincodex
In fact, a few other data sets also hinted at a similar possibility. According to Glassnode’s data, Ethereum’s NVT ratio registered a sharp decline. Whenever the metric drops, it means that an asset is undervalued, indicating that the chances of a price increase are high.
The technical indicator Relative Strength Index (RSI) moved northward. This meant that buying activity was rising. A hike in buying pressure often results in price upticks.
Read Ethereum’s [ETH] Price Prediction 2024–2025
Notably, the Chaikin Money Flow (CMF) also followed a similar increasing trend.
If ETH once again approaches the $4k resistance and is backed by strong buying pressure, then it won’t be ambitious to expect the token flipping the $4k resistance into its new support in the coming days.


Source: TradingView

