
- Ethereum high order books signal rally’s peak.
- ETH might be in a bear market but let’s find.
Ethereum [ETH], the largest altcoin, continues to capture attention due to its scalability and widespread use in the blockchain space.
However, Ethereum has been underperforming on higher timeframes for over five months, raising questions about whether the crypto market is still in a bullish phase.
On the 1-day timeframe, ETH analysis shows that the Combined Books for spot order book depth hit their peak in May.
This metric, which reflects the highs in passive limit orders (bids and asks), often signals the end of a rally, followed by a bearish trend.
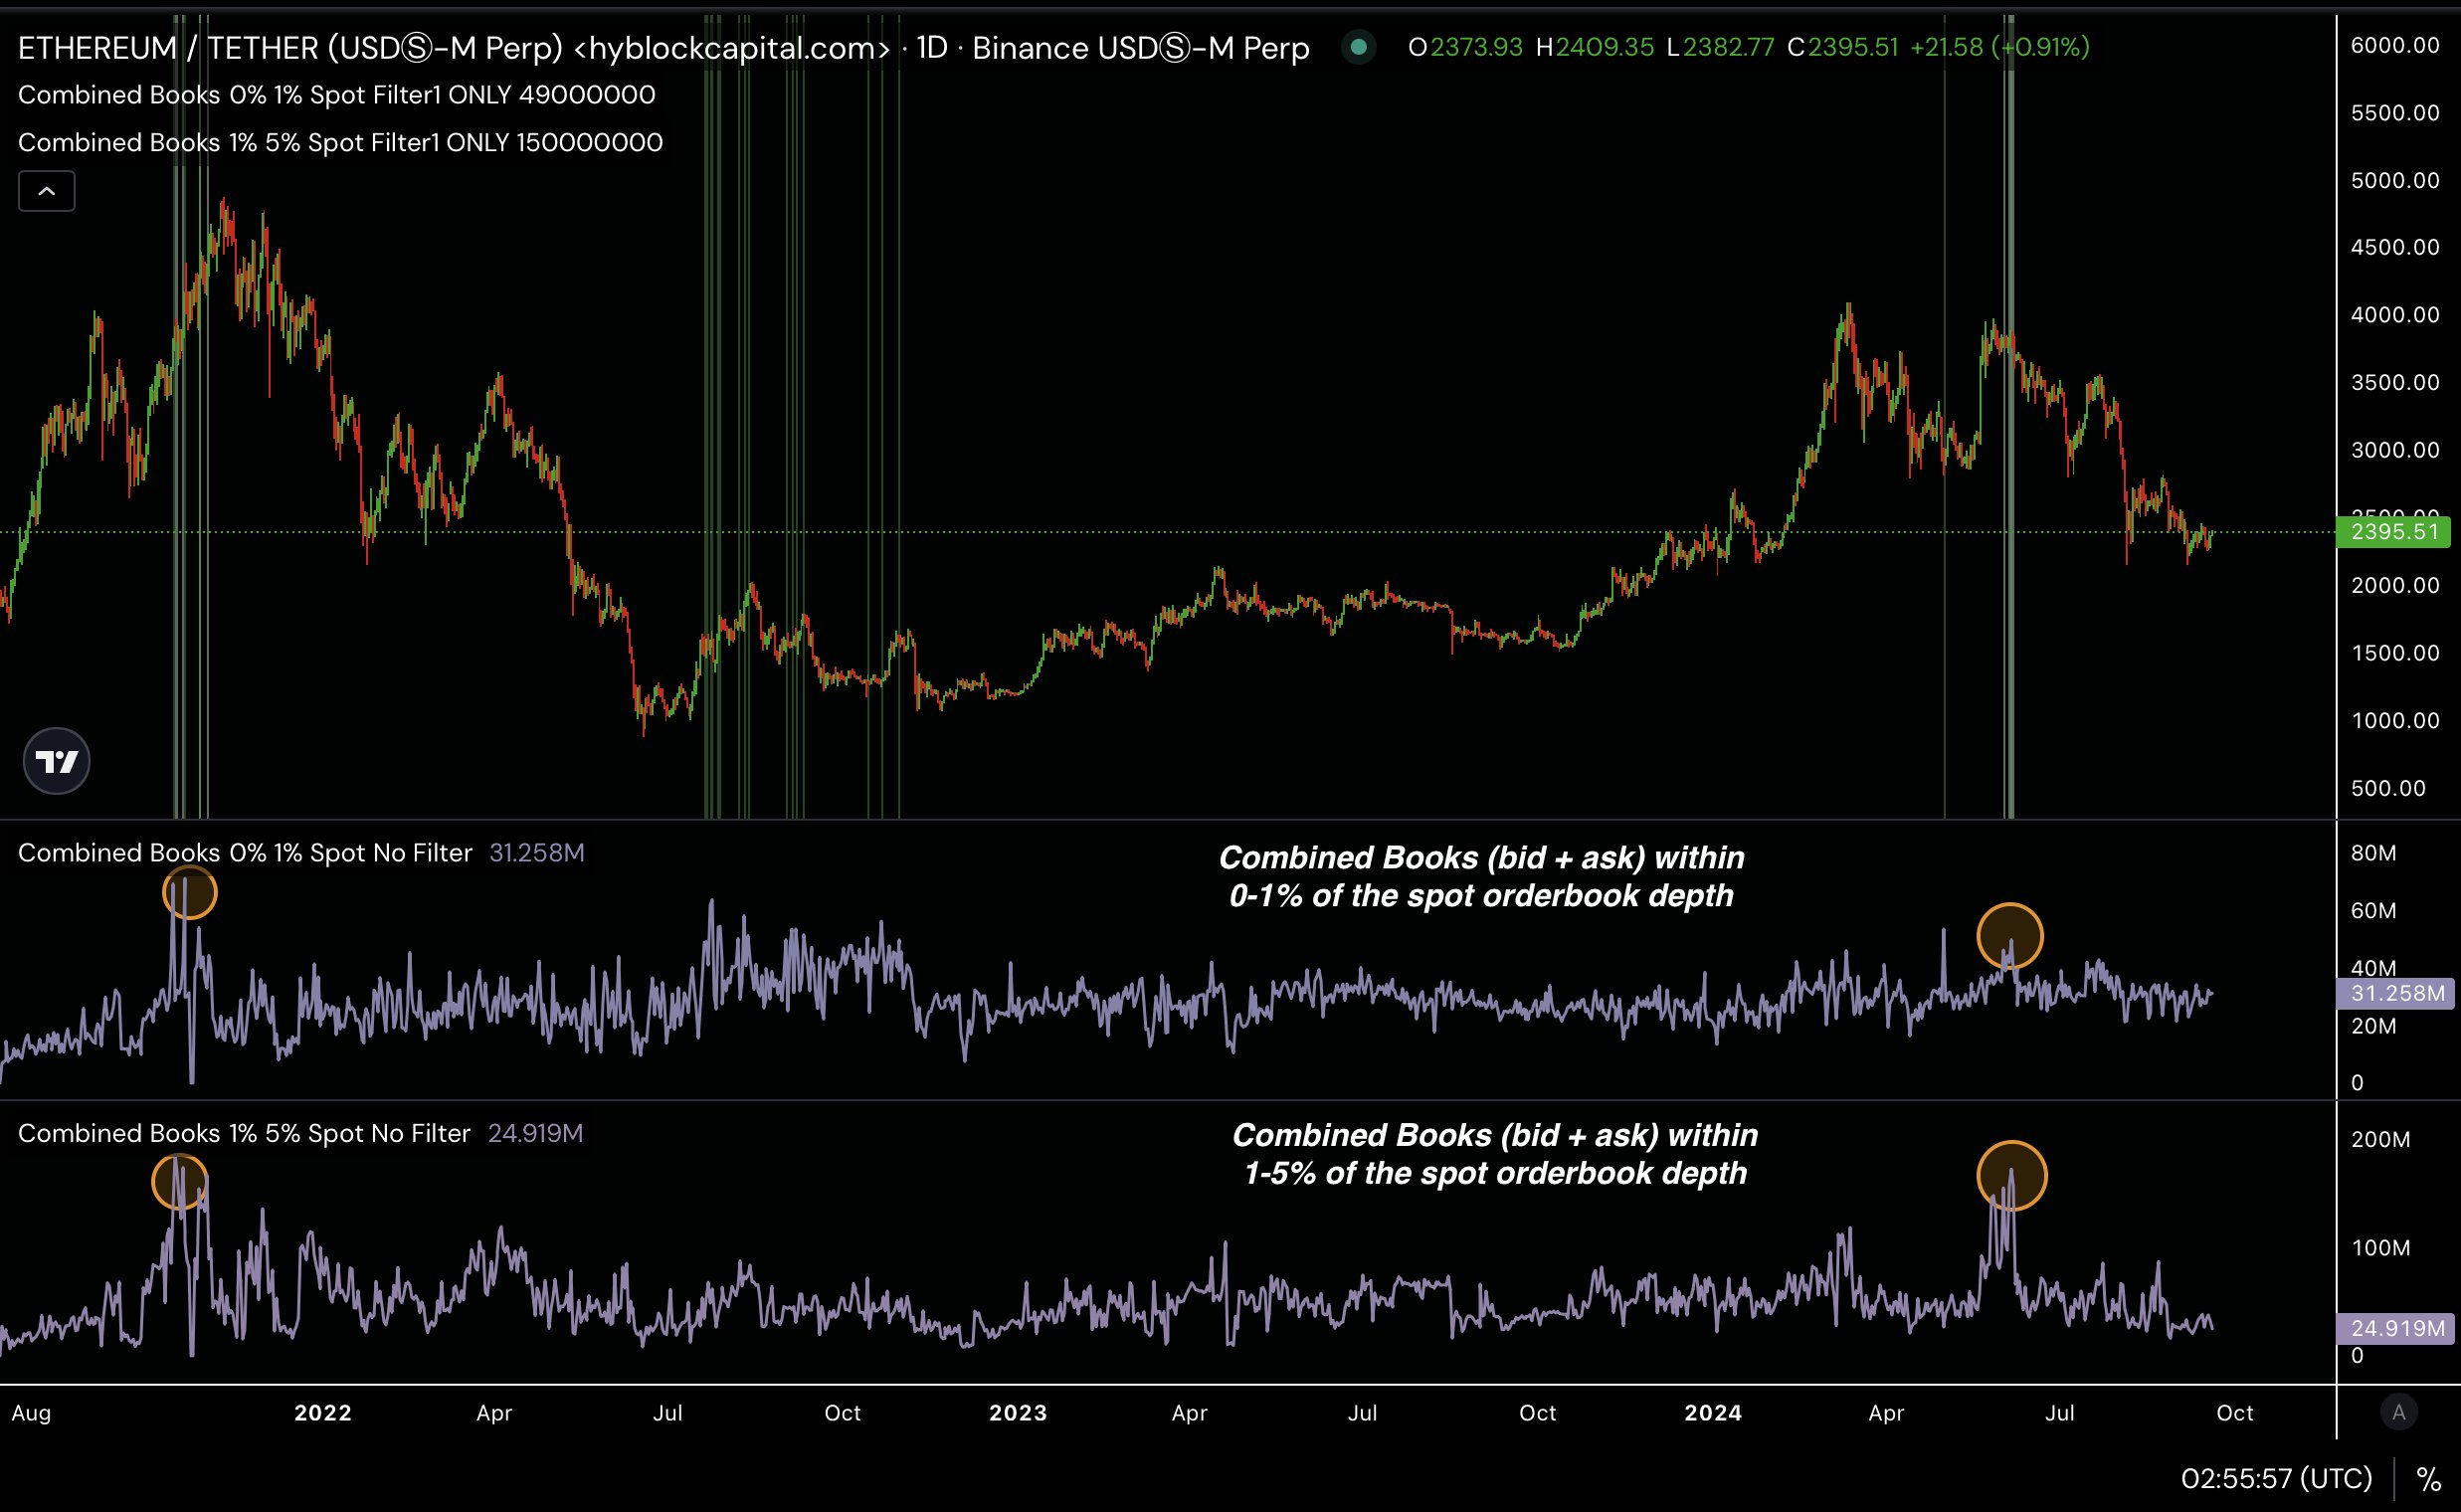
Source: Hyblock Capital
Historical data supports this, showing that ETH may have peaked during the bull run that ended in May, now the market is in a consolidation phase.
Since then, ETH has been moving sideways, with no clear direction. But does this indicate a bear market?
Is ETH in a bear market
Looking at ETH’s price action suggests the possibility of a bear market. The ETH/USDT pair has been trending downwards since early June, breaking below its range on the daily timeframe during the market crash on August 5.
Since then, it has struggled to recover, pointing to the potential for a bear market. However, ETH’s price candles are currently green, indicating a possible retracement towards $3000 from the aggressive sell-off.
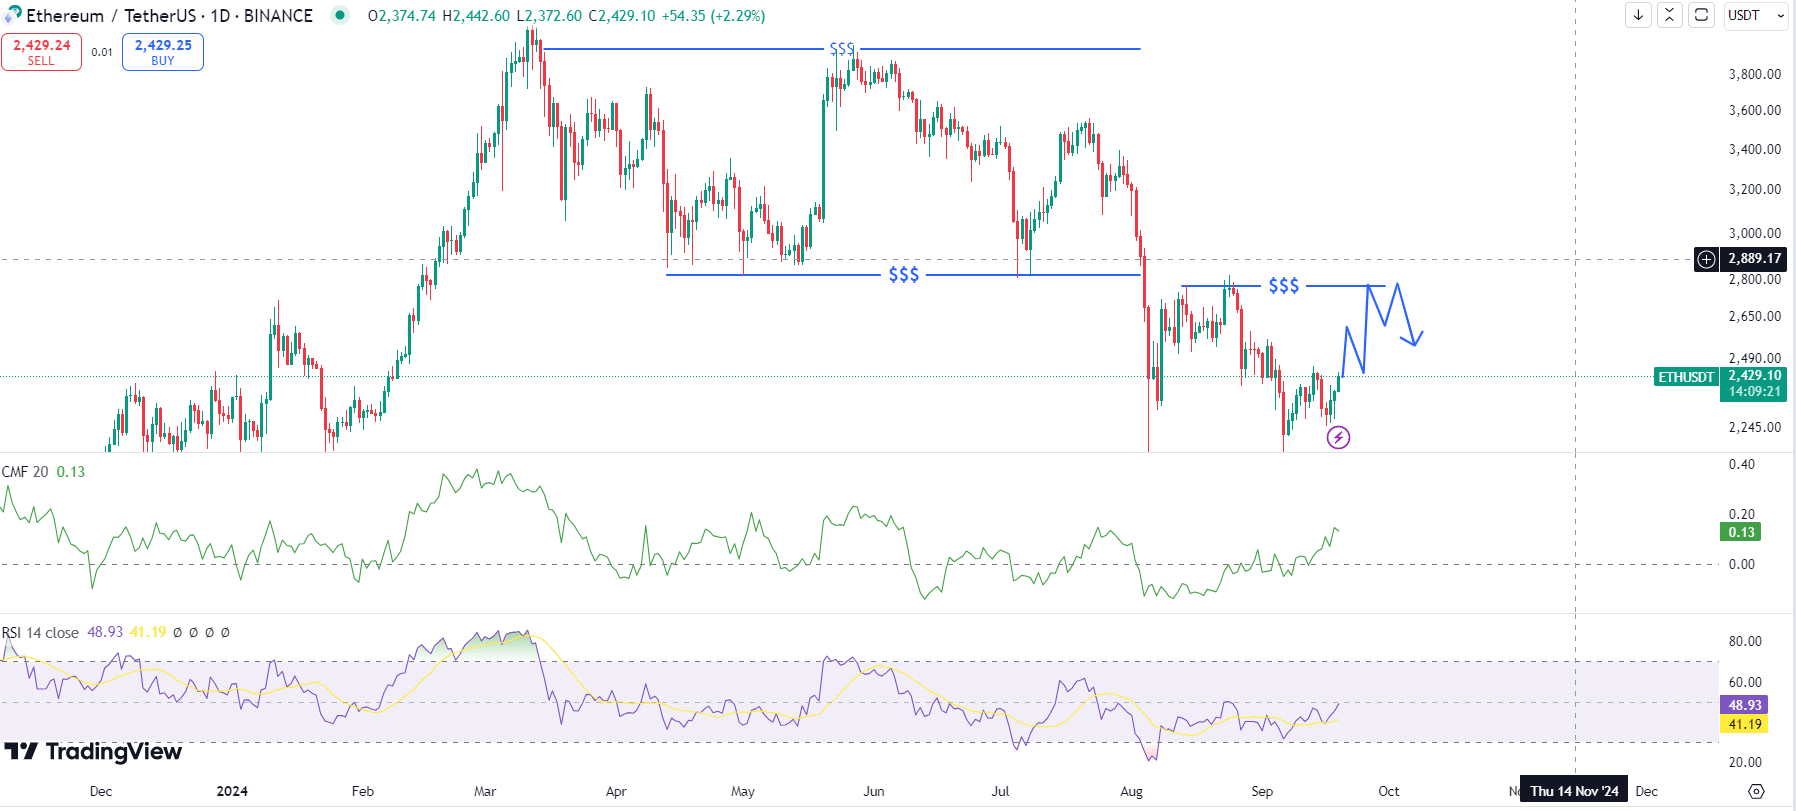
Source: TradingView
Price may stall around the $3,000 level. If ETH breaks and sustains above $3,000, a potential rally could follow. But if it fails and falls back below that level, the bear market will likely be confirmed.
Supporting this, the Chaikin Money Flow and Relative Strength Index (RSI) are both trending positively, hinting at bullish momentum until ETH hits the $3,000 zone.
Balance on all exchanges
Moreover, a deeper look at the balance of ETH on exchanges raises further concerns about a potential bear market.
Over 547,600 ETH, worth more than $1.5B as at press time, have been transferred to exchanges in the past three weeks.
This signals that traders may be taking profits or cutting their losses, both of which are bearish indicators.
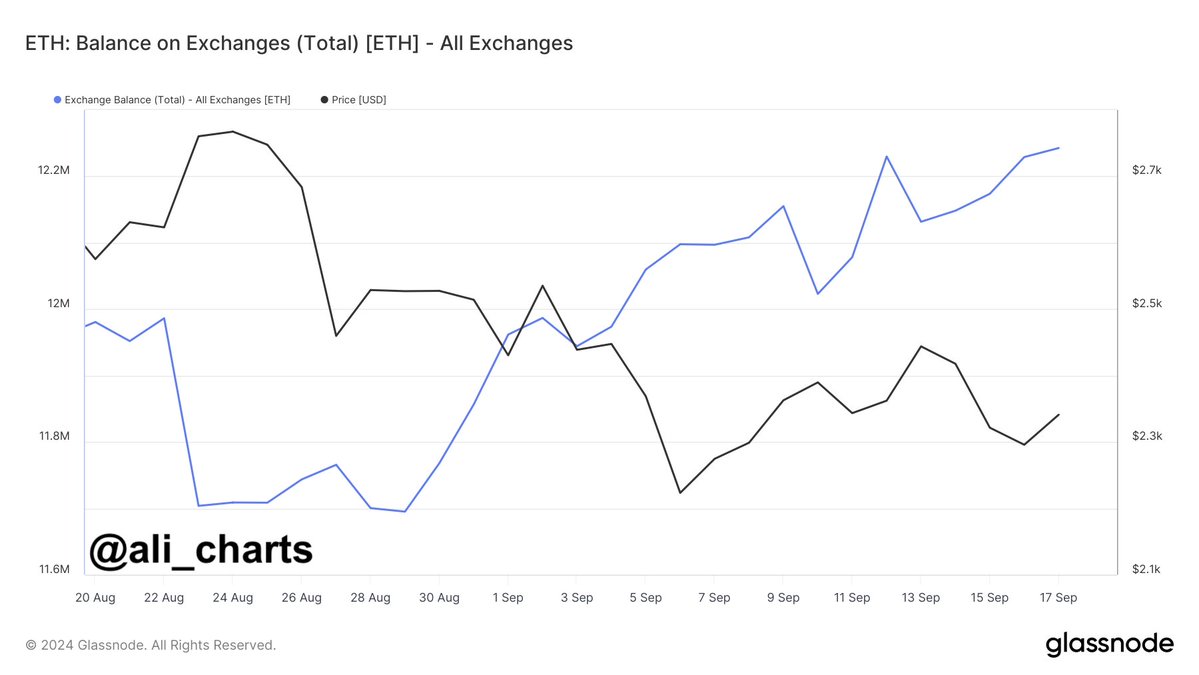
Source: Glassnode
When traders move large amounts of ETH to exchanges, it usually indicates an intent to sell, which could contribute to downward price pressure.
BTC & ETH ETF outflow continues
Additionally, Ethereum and Bitcoin ETF outflows also suggest a bearish trend. The net flow for Ethereum ETFs turned negative, with outflows of $9.8 million as of September 18, 2024.
Meanwhile, Bitcoin saw $52.7M in outflows, further reinforcing concerns about a broader market downturn. Ethereum ETFs have experienced continued outflows, and Bitcoin ETFs have turned negative after four days of inflows.
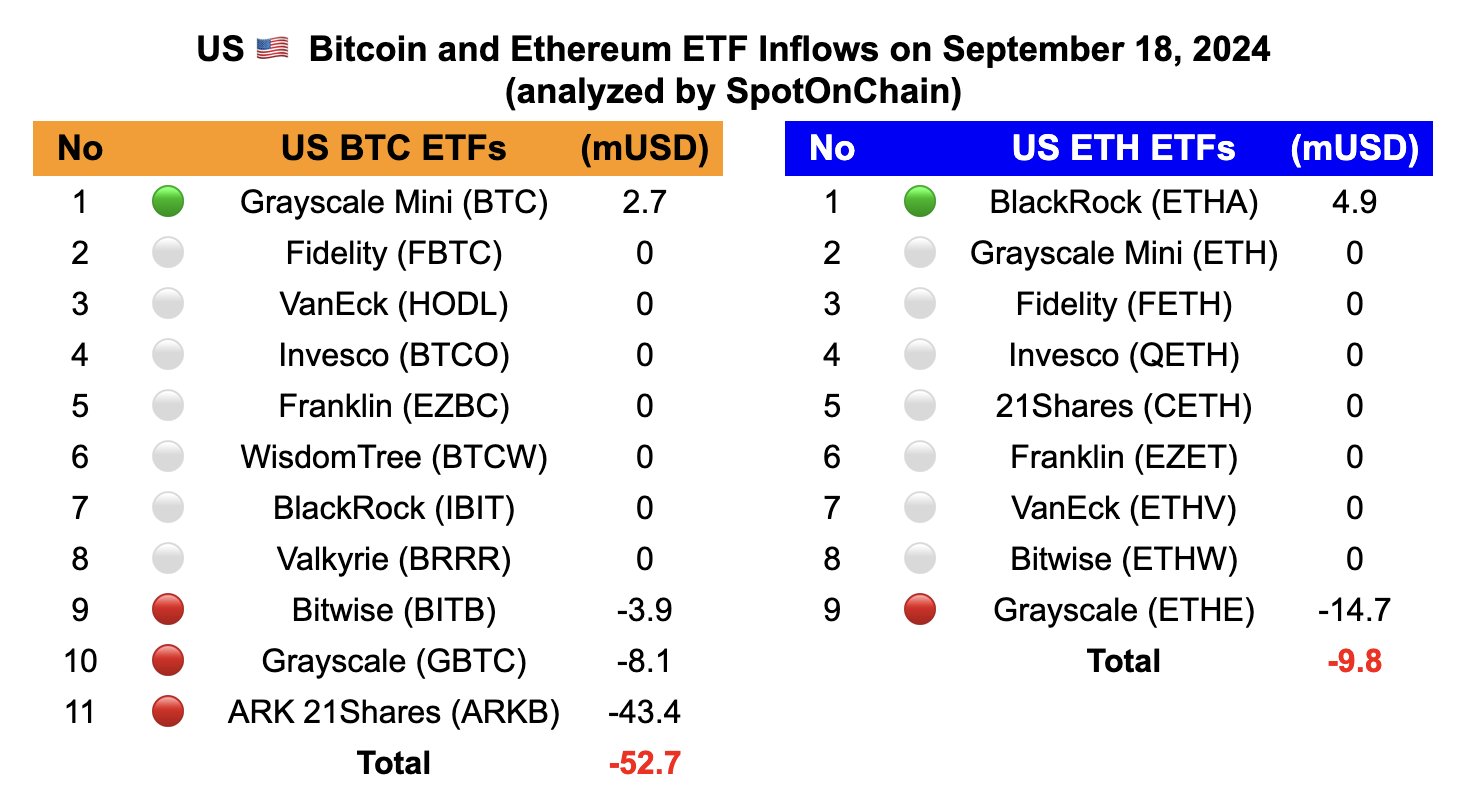
Source: SpotOnChain
Read Ethereum’s [ETH] Price Prediction 2024–2025
This behavior, especially during significant market phases, points to possible bearish sentiment or consolidation.
While it’s still unclear whether we are officially in a bear market, these factors suggest Ethereum’s price might struggle to move higher in the short term unless market conditions shift drastically.