
- ETH’s total exchange netflows have historically provided key insights into investor behavior
- ETH/USD liquidation heatmap hinted at where traders were most vulnerable to forced liquidations
At the time of writing, Ethereum’s [ETH] price movement signaled uncertainty as on-chain metrics and trading data revealed mixed sentiment among investors. Exchange netflows suggested that accumulation was underway, while liquidation zones hinted at resistance levels that could dictate ETH’s next move.
In fact, investors appeared to be positioning for a potential rally. However, key barriers need to be cleared for sustained upside momentum.
Ethereum’s total exchange netflows have historically lent key insights into investor behavior. For instance – Between January 2021 and January 2025, ETH saw varying cycles of inflows and outflows, reflecting the changing market sentiment.

Source: CryptoQuant
In May 2021, netflows peaked at 1.28k as ETH traded at $4,000. By September 2022, inflows had surged to -1.5M, aligning with a price drop to $1,200.
By May 2024, the netflows had stabilized near zero, with ETH trading at $3,800. In early 2025, outflows increased, reaching 250k as ETH hovered around $1,800.
Historically, strong outflows have indicated accumulation, suggesting that investors expect higher prices. If this trend continues, ETH could push towards $2,000 soon. However, a shift to net inflows might signal profit-taking, potentially driving ETH down to $1,500.
Here, it’s worth pointing out that the resemblance to the 2021 accumulation phase hinted at a possible rally, if demand holds steady.
Key levels to watch are…
The ETH/USD liquidation heatmap provided insights into where traders would be most vulnerable to forced liquidations. The data revealed heavy liquidation clusters between $1,850 and $1,900, with leverage exposure reaching 87.62M.
Additional clusters existed at $1,800 (64.54M) and $1,750 (45.4M). With ETH trading at $1,894.11, it seemed to be facing strong resistance near $1,900.

Source: CoinGlass
If ETH manages to break above this level, momentum could push it towards $2,000. However, failure to sustain above $1,850 might trigger cascading liquidations, increasing selling pressure and pulling ETH to $1,700.
The heatmap also suggested that traders should closely monitor the $1,750–$1,800 range as a potential accumulation zone. The liquidation pattern also mirrored Bitcoin’s resistance clusters, indicating broader market correlations.
Break-even price analysis and market direction
Finally, Ethereum’s break-even price analysis on 14 March added another layer to market predictions. Data showed that 33.60% of ETH holders were in the money at $48.25M ETH, with the break-even price at $1,803.02.
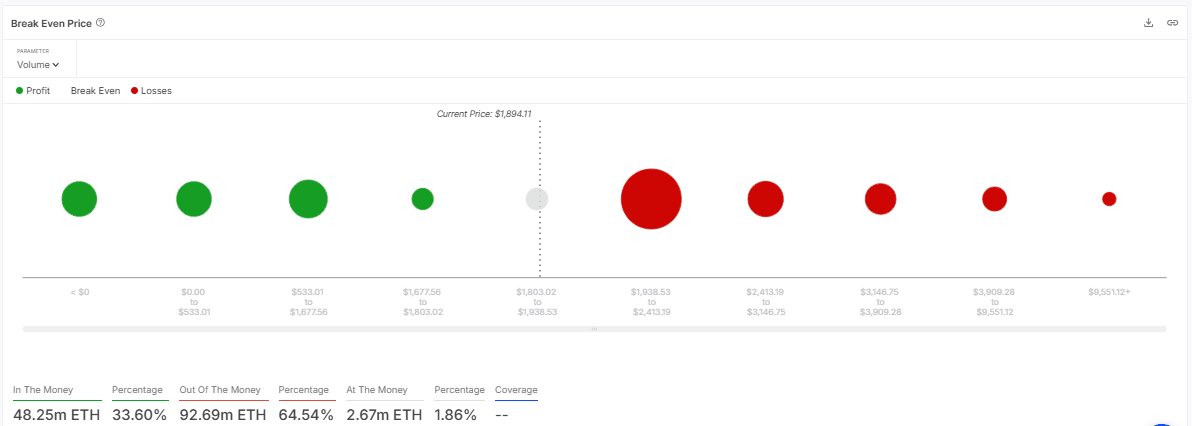
Source: IntoTheBlock
Meanwhile, 64.54% of holders were out-of-the-money, with a break-even price of $1,985.53. The at-the-money positions stood at 1.86%, totaling $2.67M ETH at $1,894.11.
With the altcoin trading near $1,894.11 at press time, its price sat above the in-the-money threshold, but below the out-of-the-money range. If buyers fail to hold support at $1,850, a drop to $1,800 or lower would be likely.
Conversely, a breakout above $1,985.53 could trigger further gains towards $2,100. The significant percentage of out-of-the-money positions suggested lingering bearish pressure, contrasting with the netflow’s bullish accumulation trend. This dynamic indicated that volatility may be likely in the short term.
To put it simply, Ethereum’s market indicators presented a conflicting yet insightful picture. Exchange netflows showed strong outflows of 250k, hinting at investor accumulation. Liquidation data identified resistance at $1,900, with safe zones near $1,800. The break-even price analysis highlighted 64.54% of traders out-of-the-money at $1,985.53 – A sign of potential downside risk.
If ETH maintains support above $1,850, it could break past resistance and aim for $2,000 or higher. However, if it fails to hold key levels, cascading liquidations could drive the price to $1,500.