
- An analysis of Bitcoin charts on the Chicago Mercantile Exchange (CME) suggested it might continue to fall
- Bounceback still likely though as fresh capital and technical indicators could provide a basis for recovery
Over the last 24 hours, Bitcoin has continued to fall on the charts, with the crypto dropping back to $83,000 after previously trading above it. Its latest decline came on the back of the asset trying to fill a CME gap on the chart.
However, new market insights indicate that further declines may be likely, especiallu since bearish sentiment is still strong. On the contrary, a rally may be only a matter of time.
Hence, the question – How will all this play out?
CME demand gap turns into supply
A drop into a CME gap often acts as a demand zone, causing prices to rebound. However, recent analysis suggested that this demand level has now turned into a supply zone.
A supply zone acts as a barrier, preventing an asset from trading higher and forcing it to form lower lows. BTC’s CME demand gap now acting as a supply zone could push the asset as low as $81,200 – The next notable level where demand may emerge.
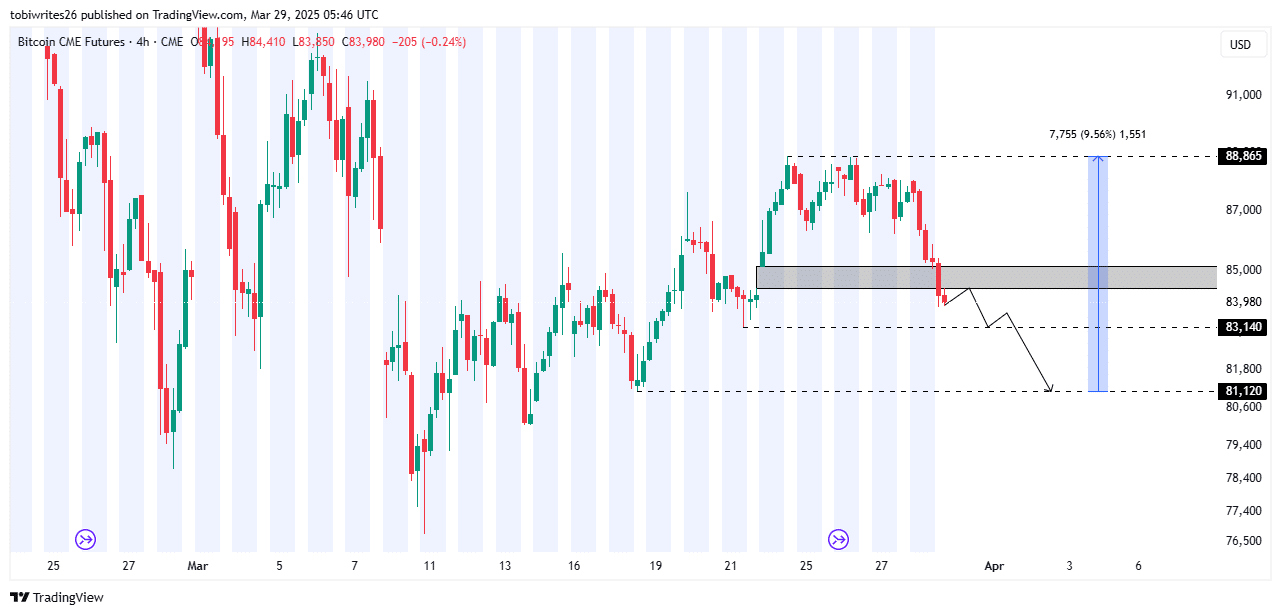
Source: TradingView
Before hitting this level, the cryptocurrency could see a temporary rebound at $83,140 – A key level of interest – before continuing south to the final marked target. From this lower level, a potential 9.57% rally to $88,000 could follow.
Bitcoin’s latest bout of depreciation has been in line with a hike in liquidity flows into the market – A sign that investors are preparing to buy as demand for stablecoins rises.
Right now, $1 billion worth of USDT has entered the market via the TRON network. If Bitcoin attracts a significant share of this stablecoin liquidity, the rally could be strong.
At the time of writing, the Relative Strength Index (RSI) and Accumulation/Distribution indicators seemed to confirm that BTC remains in a bearish phase.
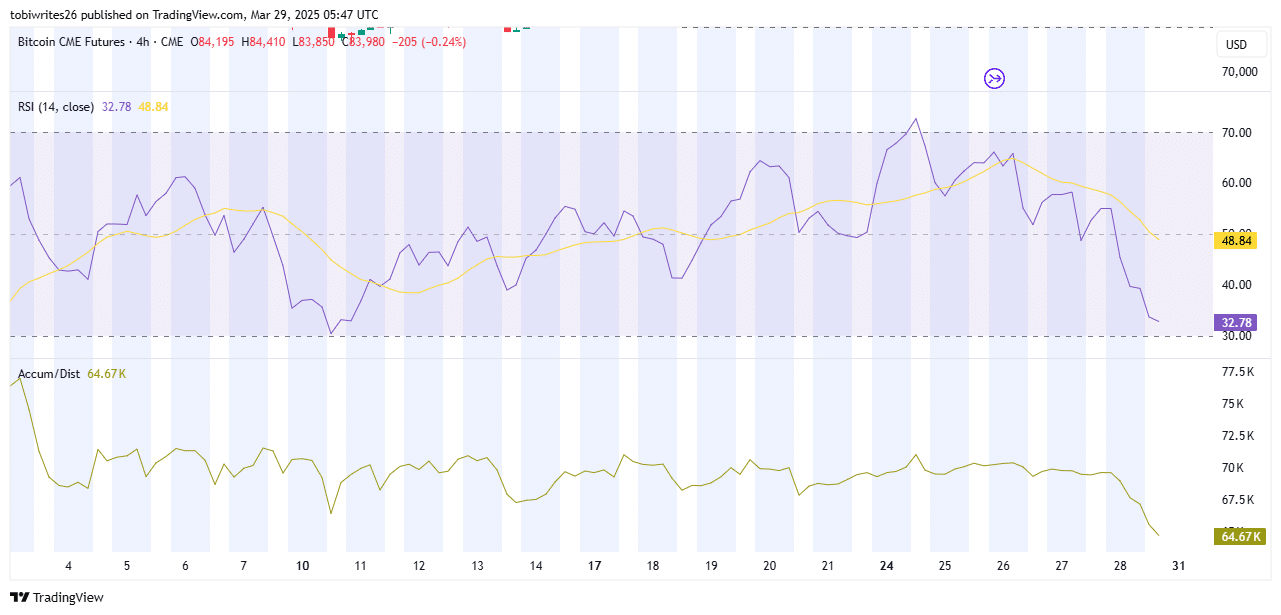
Source: TradingView
Here, the RSI was particularly notable as it seemed to be approaching the oversold zone. While the market has been bearish, this suggested that a bounce may be close. If the RSI reaches oversold levels around the key support at $81,200, a rally would be highly likely.
Similarly, the Accumulation/Distribution indicator, which tracks buying and selling pressure, was in a sell phase at press time. This confirmed BTC’s potential for further downside on the charts.
Buy commitment remains strong
Despite the latest fall on the charts, however, buy-side commitment remains strong.
In fact, over the last 24 hours, Bitcoin reserves on exchanges hit a new low – Dropping to 2.41 million.

Source: Cryptoquant
This means that holders are moving their assets to private wallets, likely for long-term storage. Lower exchange supply reduces selling pressure and helps keep the prices stable.
To put it simply, Bitcoin’s market remains bullish despite the latest price drop, setting the stage for a major price rally.