
- A study of the liquidation chart revealed FLOKI has liquidity clusters below its press time price
- Spot traders are on a three-week selling streak right now, adding downward pressure on the chart
FLOKI has emerged as among the market’s top losers after losing over 11.43% of its value in the last 24 hours. Thanks to the same, at press time, its weekly losses stood at 23%.
This selling could intensify as AMBCrypto’s analysis highlighted declining volumes across the board. This confirmed that traders have been losing momentum while bears, both derivative and spot traders, are now stepping step in.
Liquidity clusters and derivative traders ignite drop
A press time analysis of the FLOKI/USDT liquidation heatmap revealed several liquidity clusters below the press time price level of $0.00006075.
Liquidity clusters are levels on the chart where unexecuted orders in the derivative market lie, acting as a magnet pulling the price down.
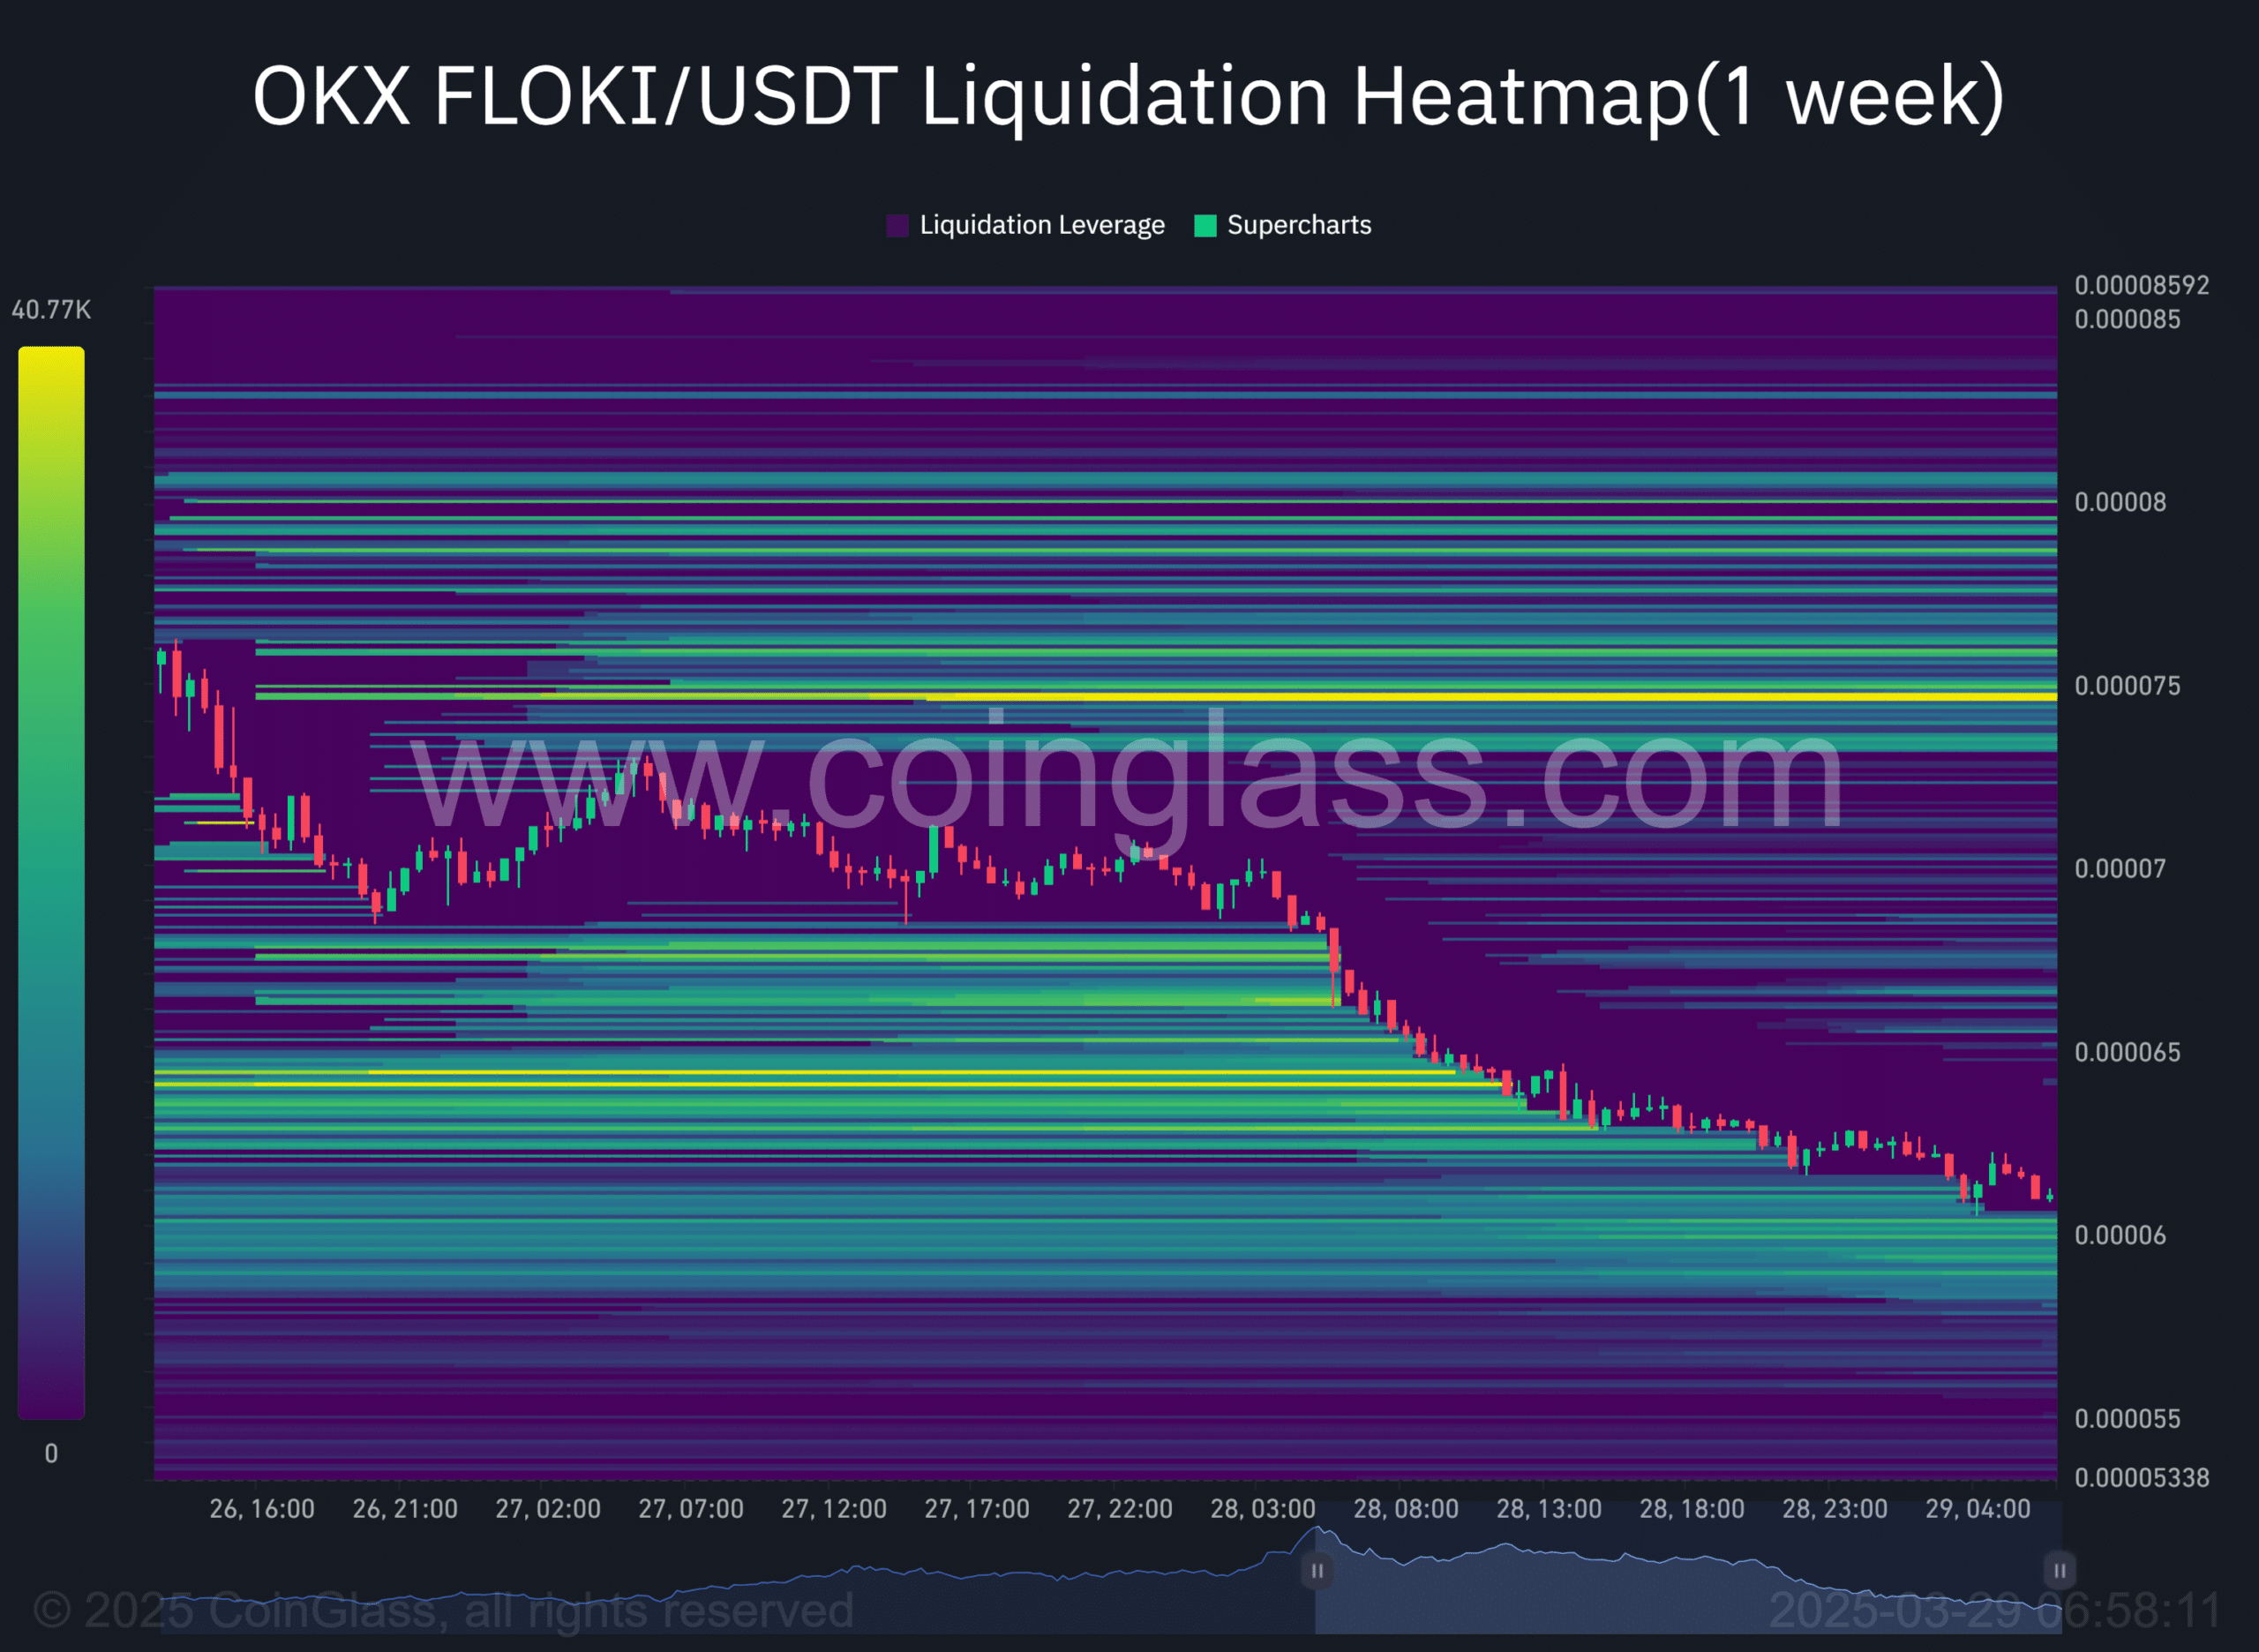
Source: Coinglass
Further analysis showed that these clusters extend to $0.000058147 – A level with zero liquidity attached to it. This price point or levels slightly above it could be where FLOKI rebounds, making a major rally move.
AMBCrypto found that the market decline to this liquidity cluster will be driven by derivative traders, as key metrics indicated. In the last 24 hours alone, the selling volume from derivative traders has overshadowed buying activity, with the same evidenced by the long-to-short ratio.
When the long-to-short ratio is below 1—the neutral threshold—it means there is more selling than buying. At the time of writing, FLOKI had a ratio of 0.7828, significantly below 1 – This suggested market participants are actively selling, rather than buying.
Open Interest has fallen accordingly too, especially as derivative traders react to the bearish wave, leaving just $14.76 million worth of unsettled contracts in the market. This drop has been largely influenced by long positions being forcefully closed.
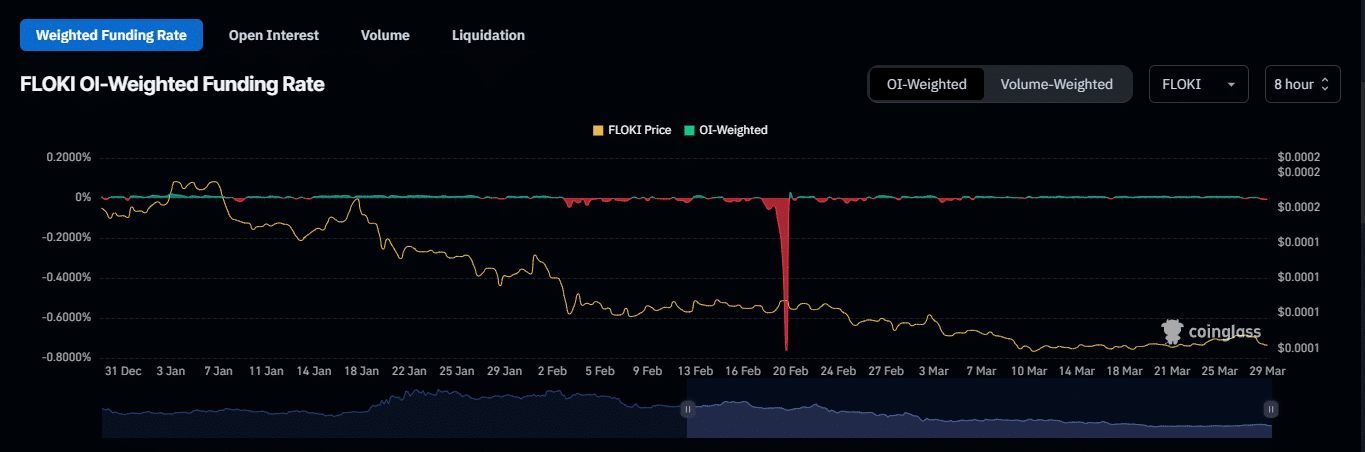
Source: Coinglass
The OI-weighted funding rate provides a clear picture of the market trend among derivative traders, with the same having a reading of -0.0143%. According to analysis, this is the most bearish the market has been since 4 March.
Spot traders are also supporting this decline, maintaining a week-over-week bearish position.
Three-week outflows from spot traders
Finally, in the spot market, traders have consistently sold – A trend that began on 10 March . According to data reported by Coinglass, $1.75 million has been sold during this period.
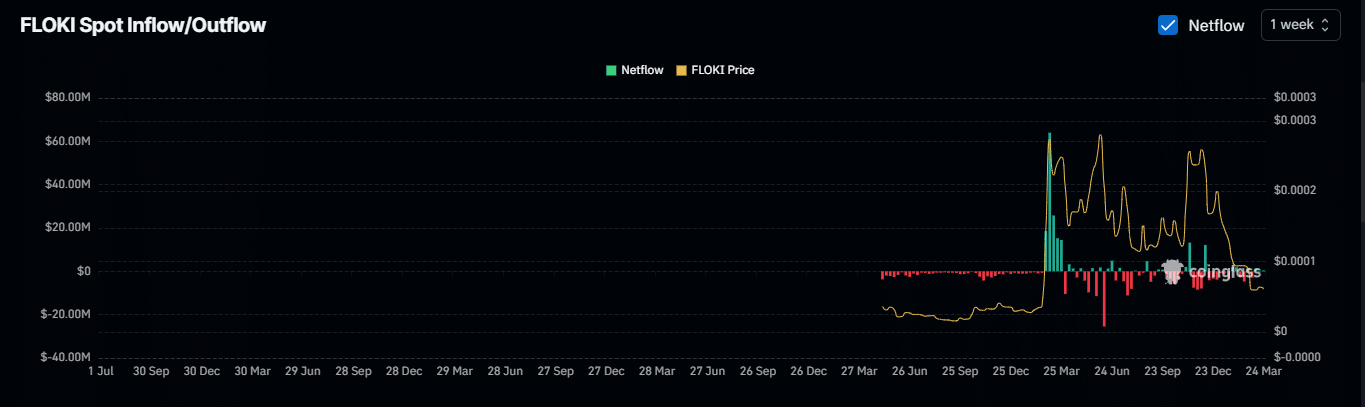
Source: Coinglass
If spot trader outflows continue alongside the selling wave from the derivative market, FLOKI’s decline could accelerate. Despite key metric fluctuations, the memecoin remains in a bearish zone right now.