
contributor
Posted:
- SAND could decline by 15% to reach the $0.231 level unless it breaks above the $0.29 level.
- The token’s Long/Short Ratio was 0.84 at press time, indicating bearish market sentiment.
After experiencing a notable rally over the past few days, The Sandbox [SAND] looked poised for a price decline as millions of tokens are being dumped onto centralized exchanges.
Wallet dumps 25M SAND
On the 25th of September, on-chain analytic firm Eyeonchain made a post on X (formerly Twitter) that wallet address “0x010” linked to The Sandbox had dumped 25 million tokens, worth $7.08 million, to Binance and OKX.
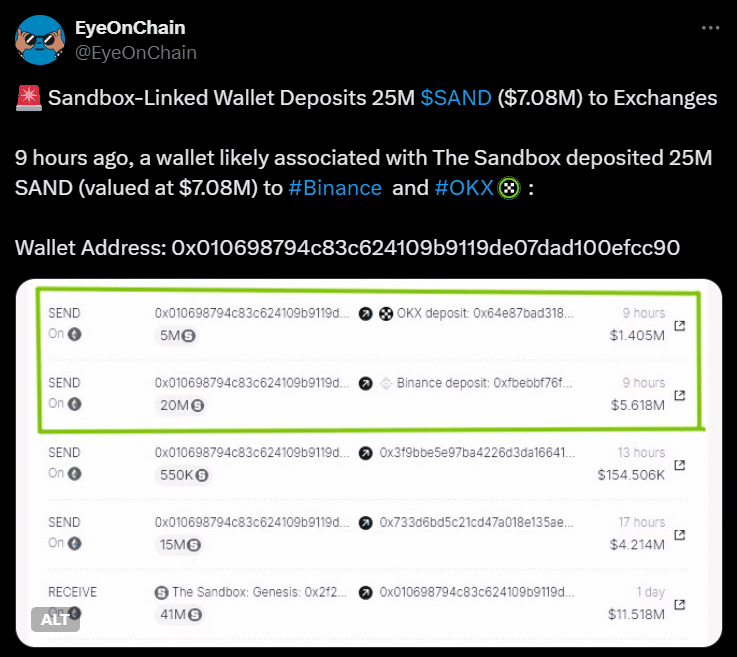
Source: X
The post on also noted that this wallet received 41 million SAND worth $11.32 million from The Sandbox. Also, a significant portion of these tokens have already moved to the CEXes, indicating a potential sell-off.
The Sandbox: price momentum
Despite this significant dump, SAND hasn’t seen any major price changes in the past few hours. At press time, SAND was trading near $0.281 and has experienced a modest 1% price surge over the past 24 hours.
During the same period, its trading volume jumped by 21%, indicating higher participation from traders and investors.
According to AMBCrypto’s technical analysis, SAND appeared bearish at press time, and was trading below the 200 Exponential Moving Average (EMA) on a daily time frame, indicating in downtrend.
The 200 EMA is a technical indicator used by traders and investors to determine whether an asset is in an uptrend or downtrend.
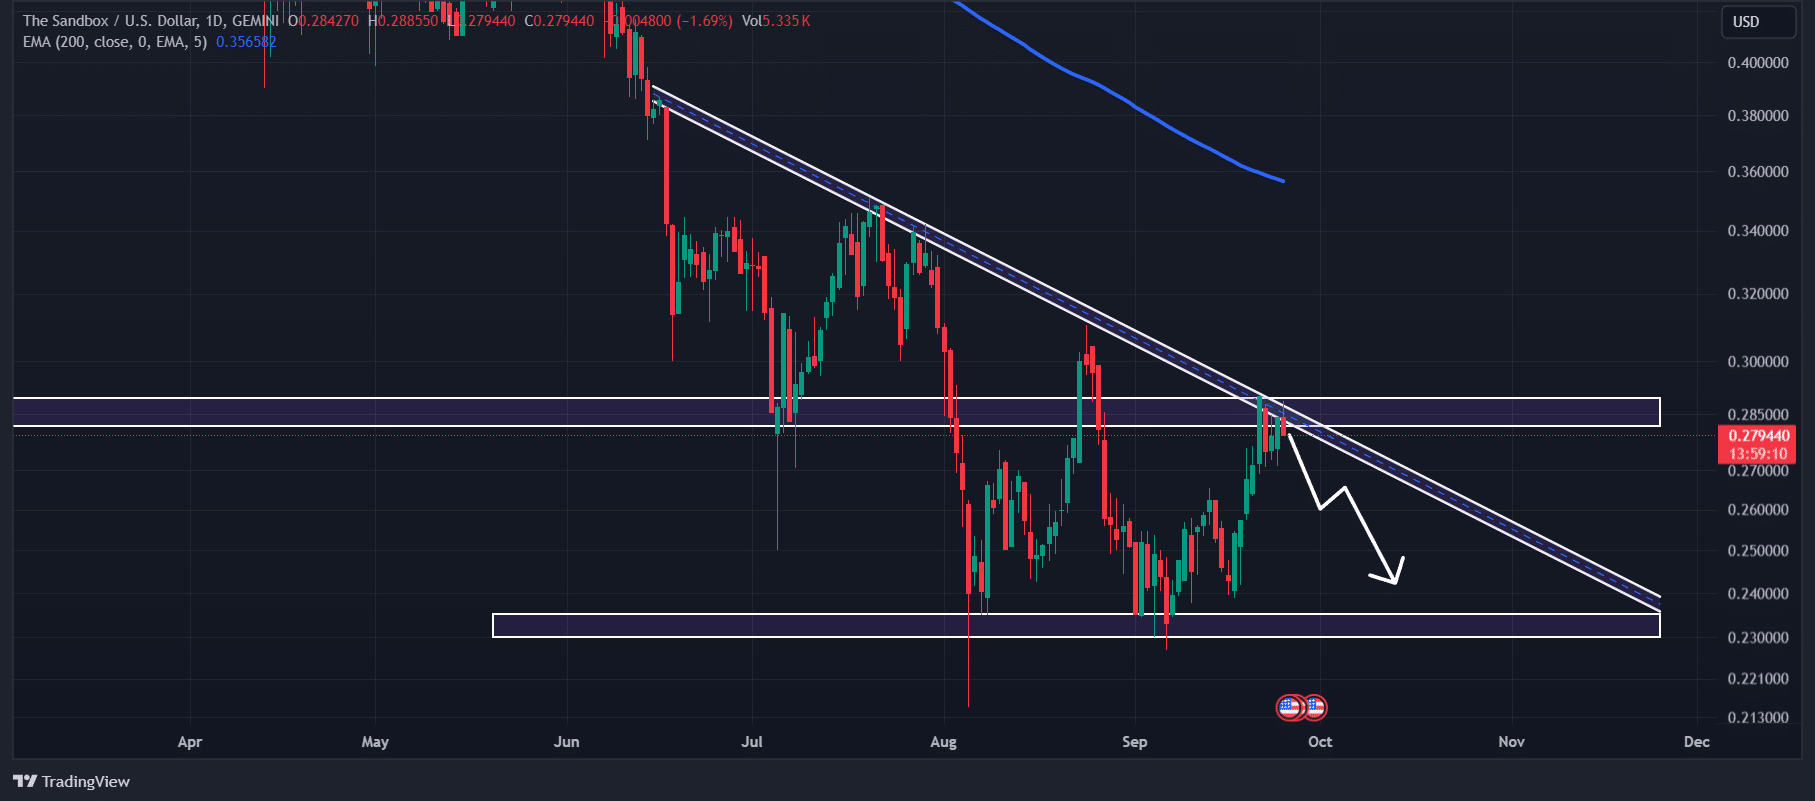
Source: TradingView
Additionally, the asset was facing a price reversal from a crucial resistance level of $0.288 at press time.
Based on the historical price momentum and the recent token dump, there is a strong possibility that SAND could decline by 15% to reach the $0.231 level in the coming days.
The bearish outlook for The Sandbox will only hold if SAND remains below the $0.29 level, otherwise, it may fail.
Bearish on-chain data
This negative outlook was further supported by on-chain metrics. SAND’s Long/Short Ratio was 0.84 at the time of writing, indicating bearish market sentiment among traders.
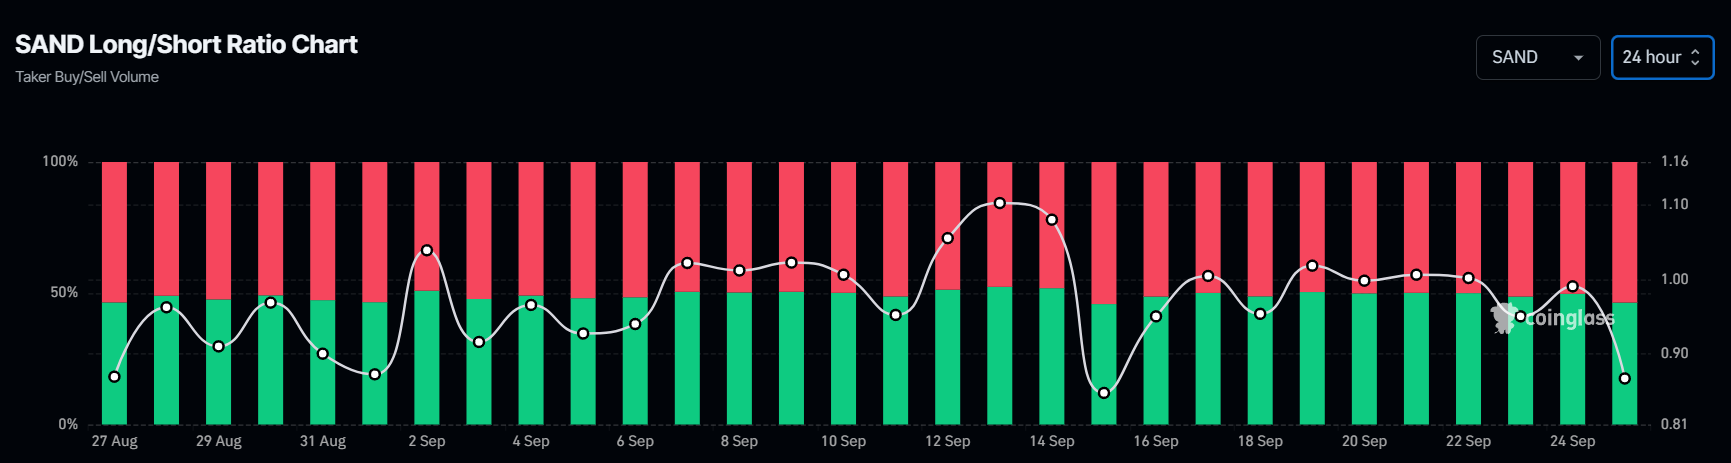
Source: Coinglass
Read The Sandbox’s [SAND] Price Prediction 2024–2025
Additionally, its Futures Open Interest increased by 4.2% over the past 24 hours, indicating that bears were betting more on short positions than long ones.
At the time of press, 54.14% of top traders held short positions, while 45.86% held long positions. Thus, bears were dominating the asset and were potentially creating selling pressure in the coming days.