- SHIB’s price surged in double digits last week.
- However, a few indicators turned bearish on the memecoin.
The crypto market remained bullish last week, allowing several cryptos, including Shiba Inu [SHIB], to register massive gains. Thanks to that, the world’s second-largest memecoin managed to break above a bullish pattern, suggesting a further price hike in the coming days.
Shiba Inu’s bullish breakout
As per CoinMarketCap, Shiba Inu witnessed a more than 13% price hike in the last seven days. At the time of writing, the memecoin was trading at $0.00001514 with a market capitalization of over $8.9 billion, making it the 13th largest crypto.
While that happened, World Of Charts, a popular crypto analyst, recently posted a tweet revealing an interesting development.
As per the tweet, a bullish falling wedge pattern appeared on SHIB’s chart. The bullish pattern first emerged in March and since then has been consolidating, only to break out on the 24th of August.
The latest breakout above the falling wedge hinted at a further price hike, which could allow SHIB to retest its March highs in the coming weeks.

Source: X
However, SHIB’s price action turned bearish in the past 24 hours. This was the case as SHIB’s value dropped by 0.3%.
Therefore, AMBCrypto planned to take a closer look at the memecoin’s state to understand how likely it is for SHIB to regain bullish momentum.
What to expect from SHIB
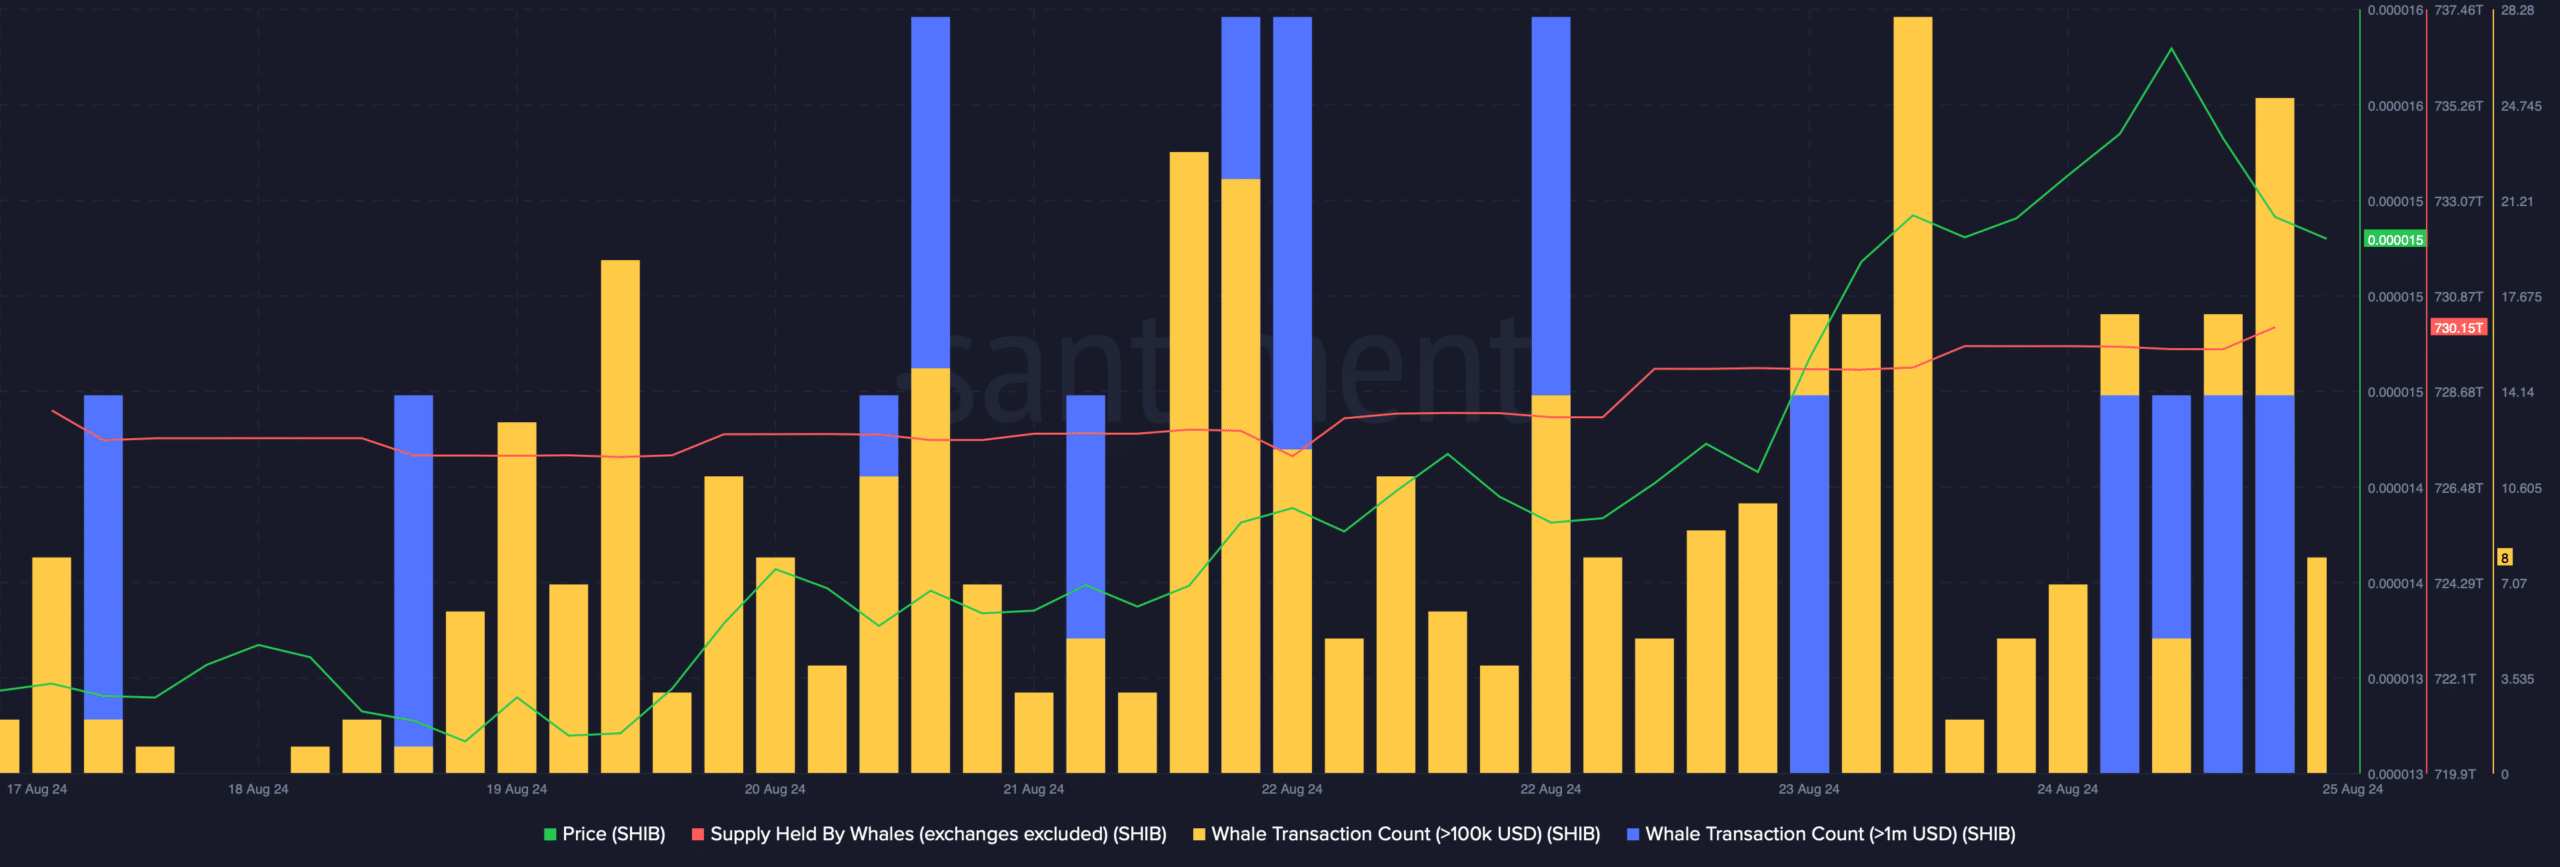
Our analysis of Santiment’s data revealed that the big pocketed players in the crypto space were actively trading Shiba Inu. This was evident from the rise in its whale transaction count.


Source: Santiment
Additionally, the memecoin’s supply held by whales also registered a slight uptick, suggesting that the whales were confident in SHIB as they expected a price hike.
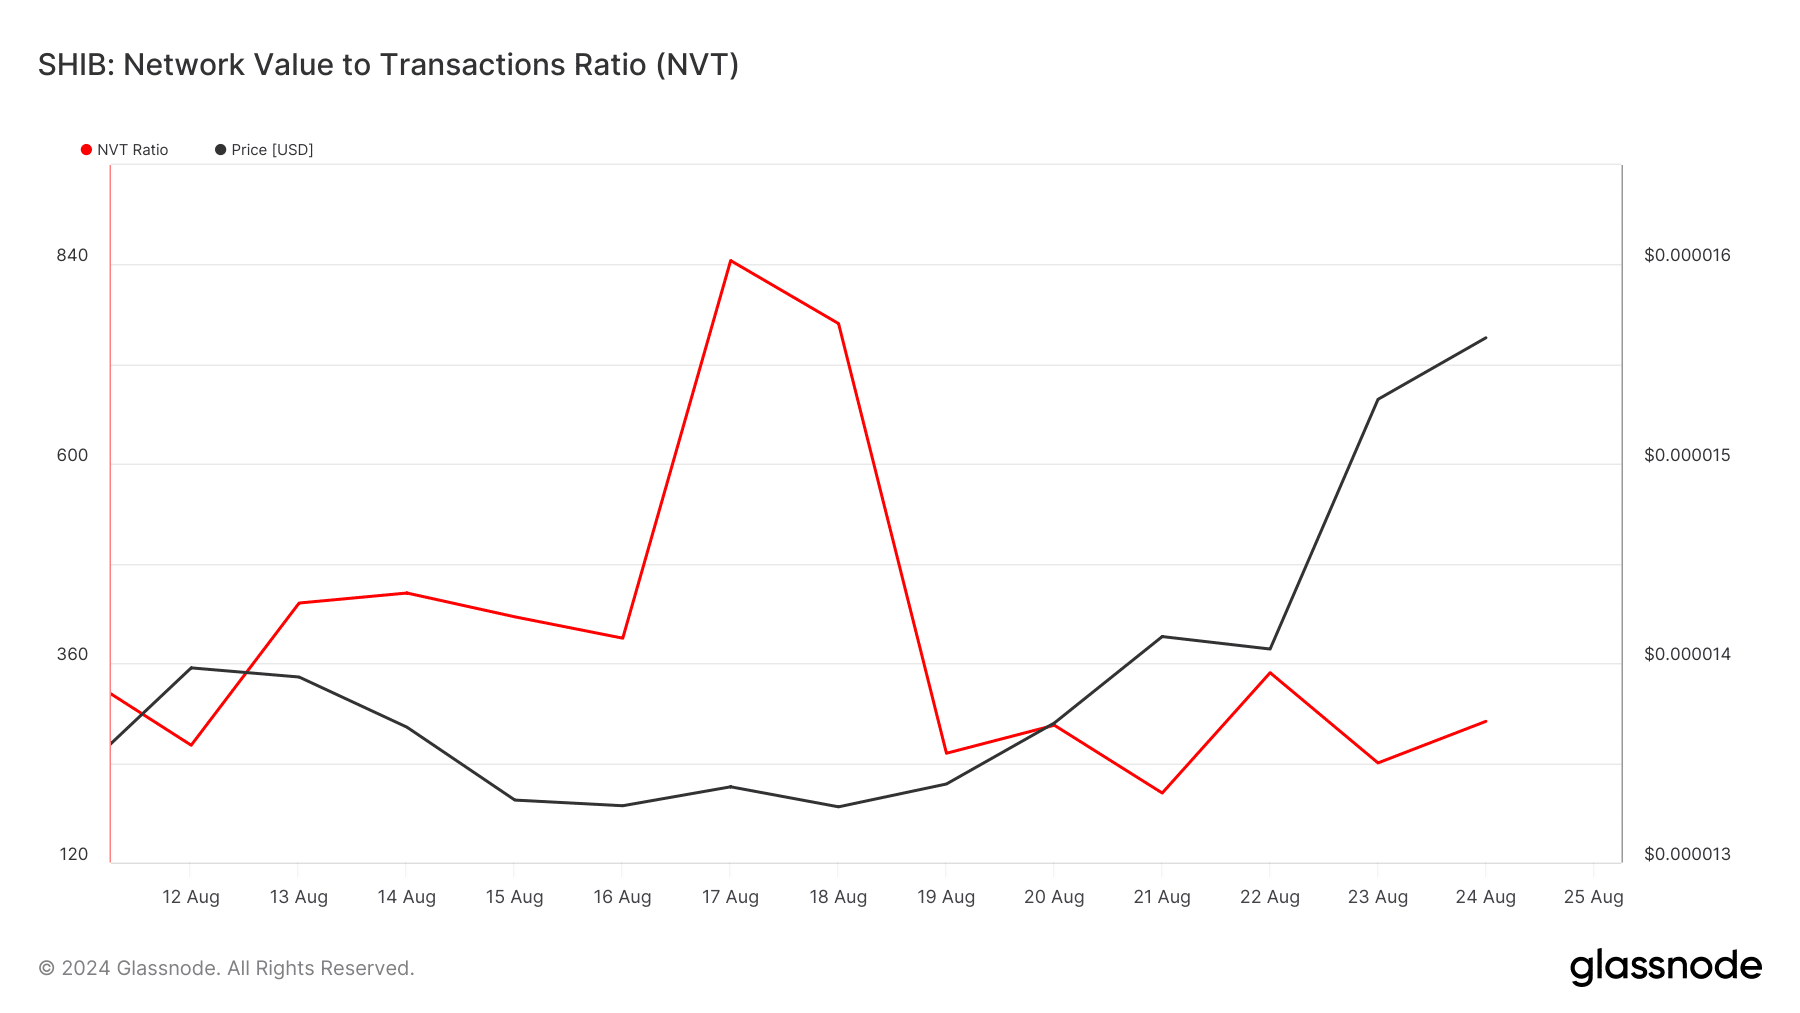
Apart from this, AMBCrypto’s analysis of Glassnode’s data also pointed out a bullish metric. We found that SHIB’s NVT ratio registered a downtick.
Whenever the metric drops, it indicates that an asset is undervalued, hinting at a price rise. However, at press time, the metric gained upward momentum.


Source: Glassnode
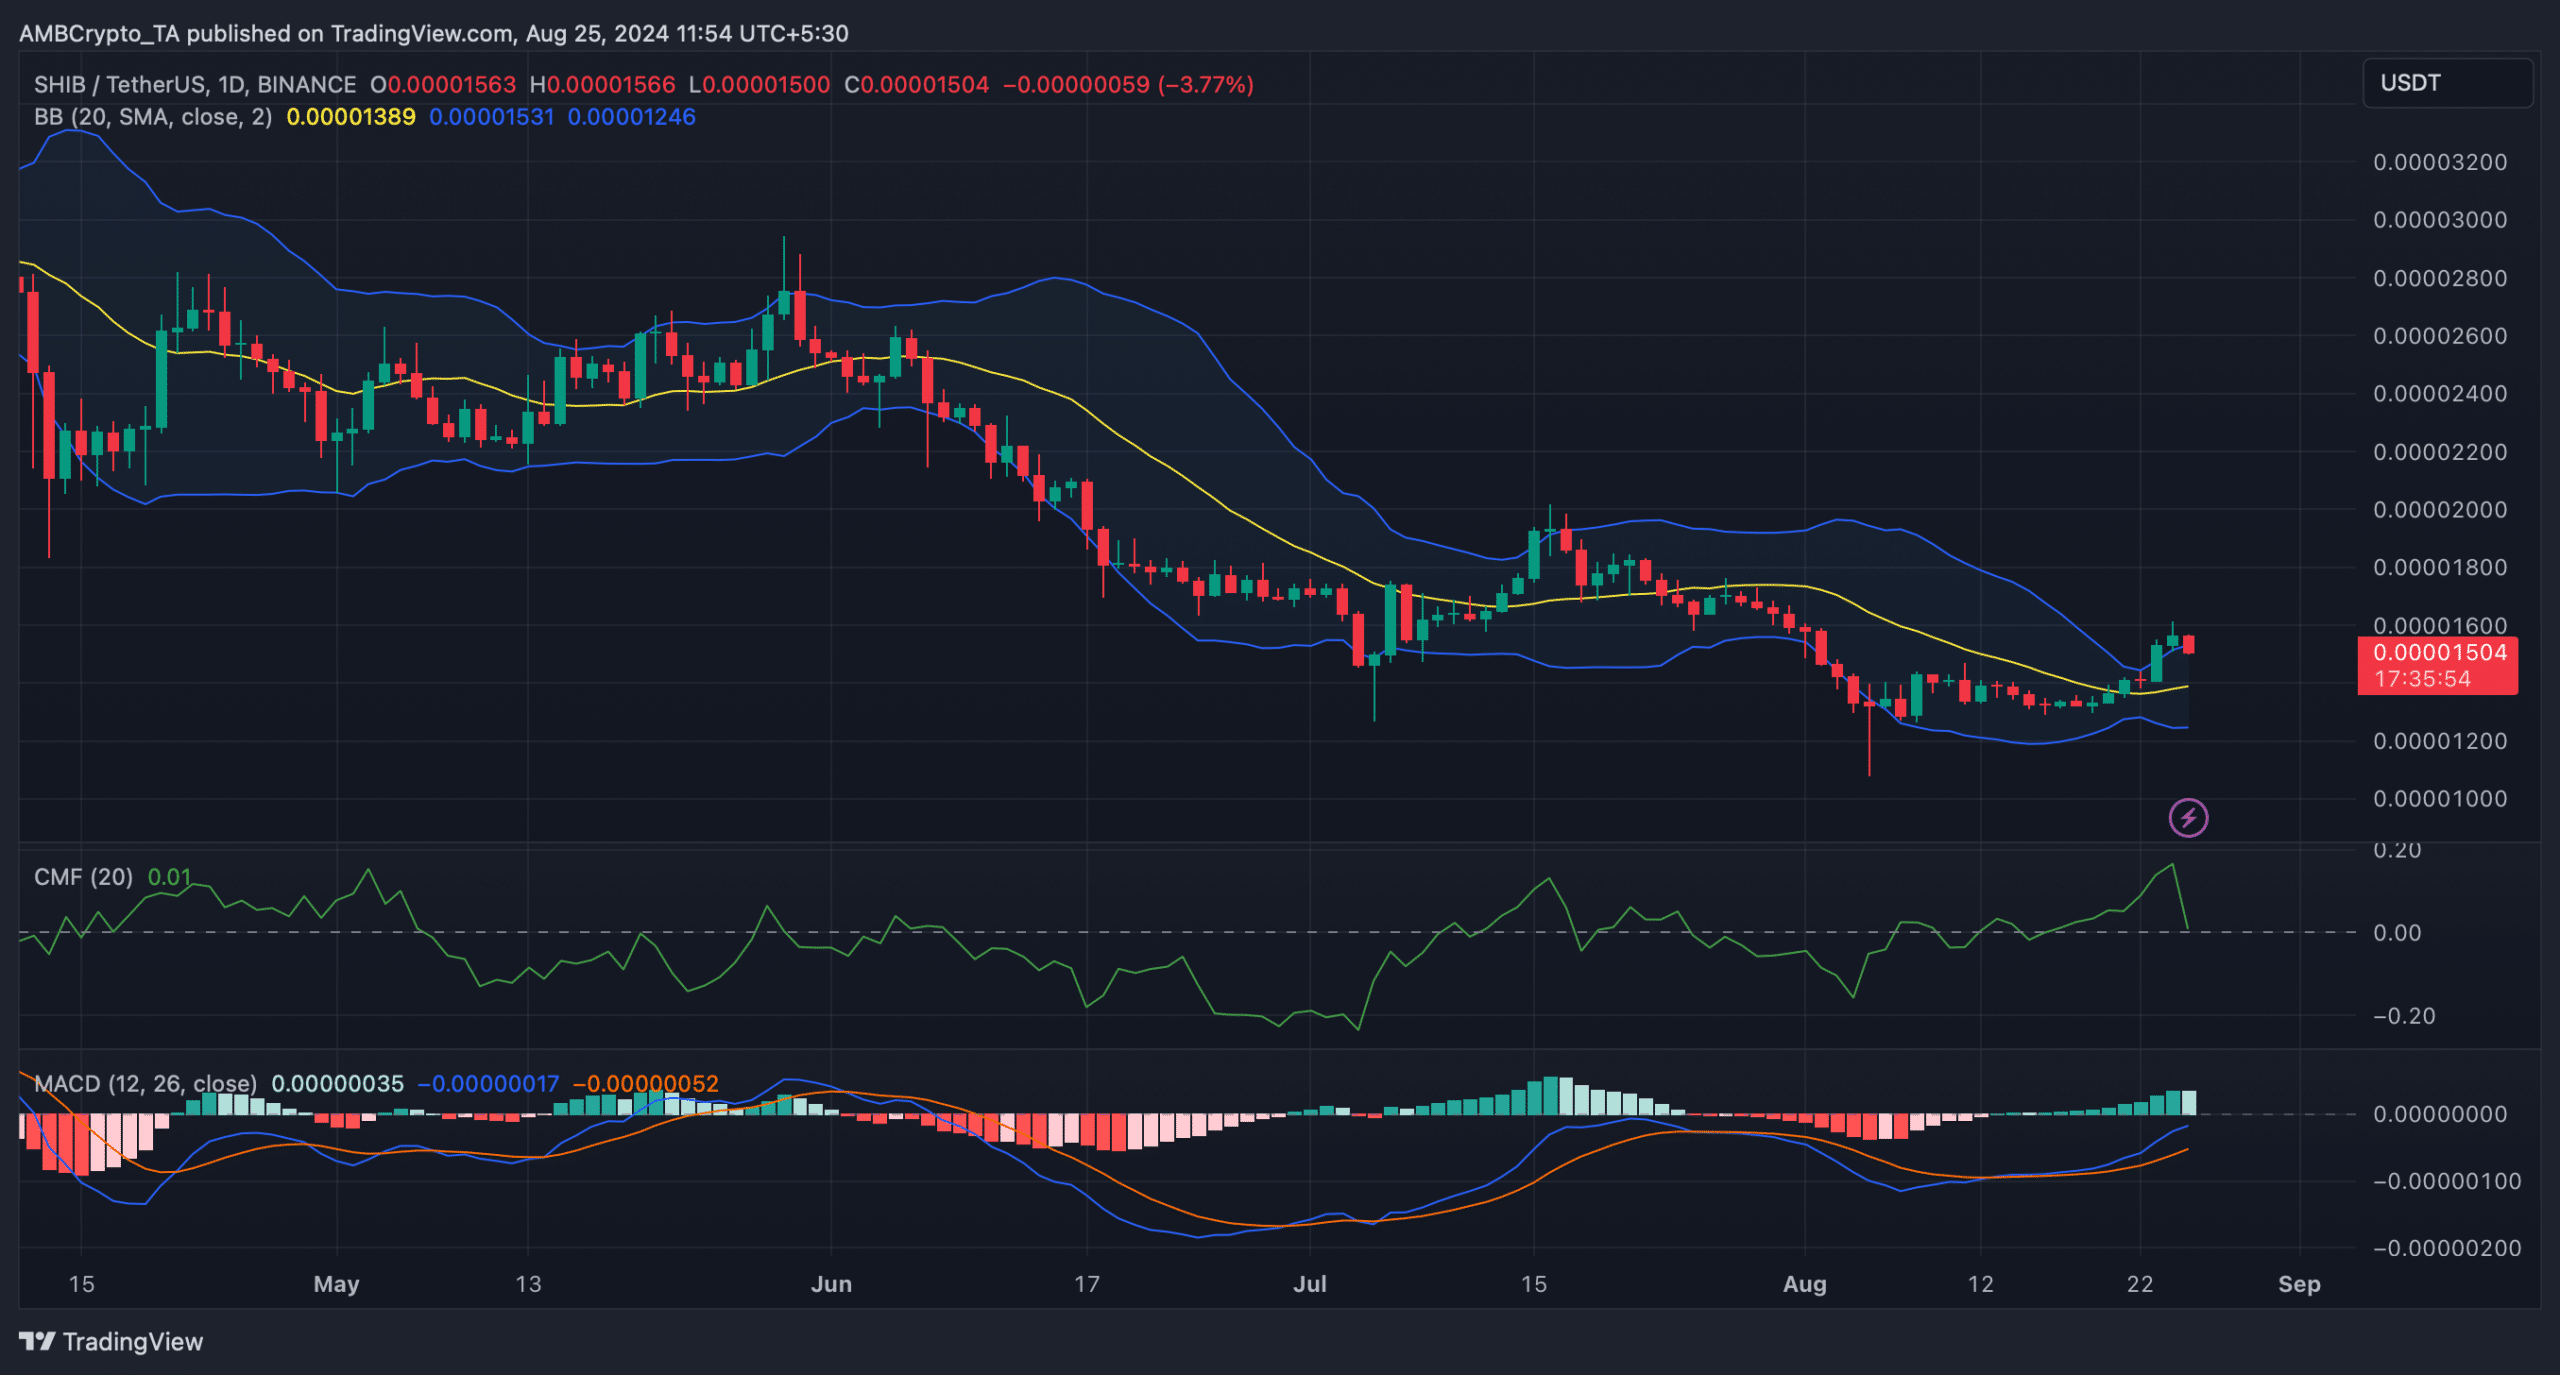
Shiba Inu’s price had touched the upper limit of the Bollinger Bands, which often results in price corrections. On top of that, SHIB’s Chaikin Money Flow (CMF) also dipped sharply, further hinting at a price drop.
Nonetheless, the MACD remained in the buyers’ favor as it displayed a bullish advantage in the market.


Source: TradingView
Is your portfolio green? Check out the SHIB Profit Calculator
While SHIB’s near-term future seemed somewhat uncertain, the ecosystem’s token BONE ShibaSwap [BONE] already turned bearish. The token price had dropped by more than 2% in the last 24 hours.
At press time, it was trading at $0.4419 with a market cap of over $101 million.

