
- Solana has seen a significant decline in trading volume, with the same falling to its lowest level of 2024
- On the charts, SOL might be at the risk of dropping lower, especially if total value locked (TVL) falls further
Over the past month, Solana’s price has exhibited some sluggish market performance, dropping by 36% on the charts. At the time of writing, martket sentiment seemed to be hinting at a further decline as more sellers stepped in.
An analysis of liquidity movement revealed a hike in SOL outflows over the past month. This is a trend that appears to be continuing, particularly as it loses a key support level that would typically provide a rebound.
Momentum falls massively as SOL weakens
A major contributing factor to Solana’s decline has been the sharp drop in momentum. In fact, press time data revealed that the altcoin’s trading volume has fallen to its lowest level, with just $3 million in daily trading volume – A level last seen in September 2024.
When both trading volume and price fall simultaneously, it means that market participants are selling their holdings. This could potentially lead to further drops in demand.
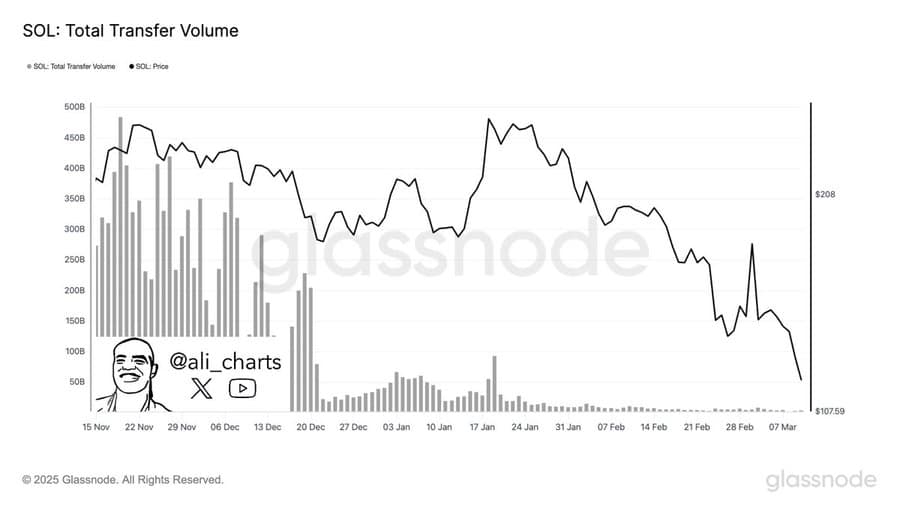
Source: Glassnode
TVL, which tracks liquidity flow within Solana-based protocols, also dropped significantly. After peaking at $12.19 billion in January, it has nearly halved, with the same standing at $6.69 billion at press time.
Such massive liquidity outflows across protocols are a sign that investors who initially locked their assets are now selling them. This, likely due to declining confidence in the asset and an effort to protect themselves from further price drops.
Potential drop to $100 or below
AMBCrypto’s analysis of SOL’s price movement suggested that the asset could decline to $100 after losing the key support level at $128.01.
Typically, support levels provide a cushion for price and facilitate rebounds, creating a drop-to-rally scenario. However, when they are breached, it means that selling momentum outweighs buying pressure at those levels.
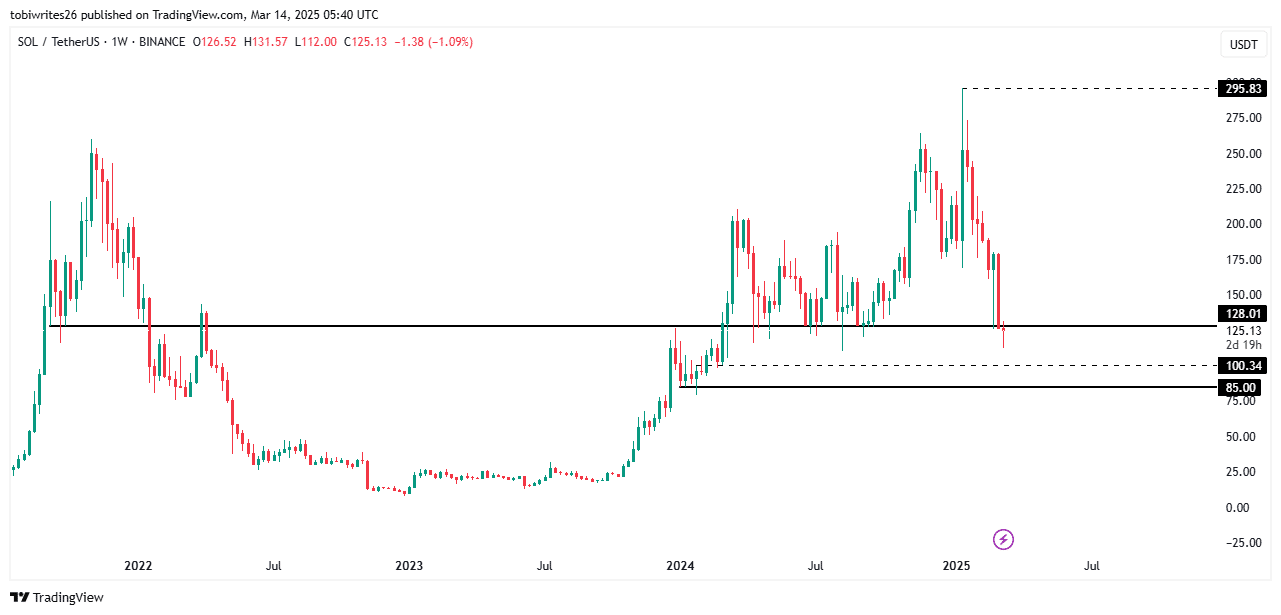
Source: TradingView
If SOL fails to hold above the next support at $100.34, further declines to $85 could follow. This will bring the asset back to the two-digit price range—A level last seen in 2024.
An analysis of the liquidation heat map revealed several liquidity clusters between $120 and $114. These clusters often act as magnets, drawing the price towards them and, in some cases, pushing it lower.
Given the prevailing downtrend, SOL could drop even further, setting new lows on the charts.
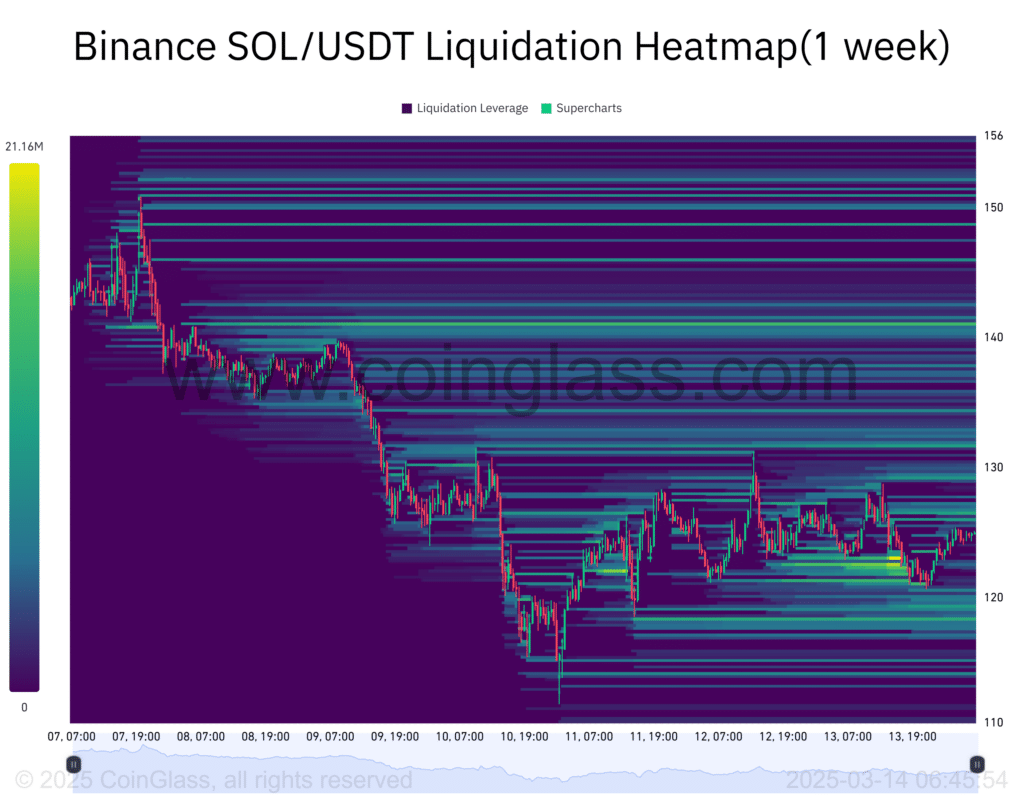
Source: Coinglass
Not all traders are bearish
In the derivatives market, some traders have been placing long bets in anticipation of a SOL rebound. Recently, buying volume in the derivatives market has increased alongside the OI-weighted funding rate.
Coinglass’s long-to-short ratio, which measures the buying volume relative to selling volume, had a reading of 1.004 at press time. A level above 1 indicates that there are more buyers than sellers within that period.
Source: Coinglass
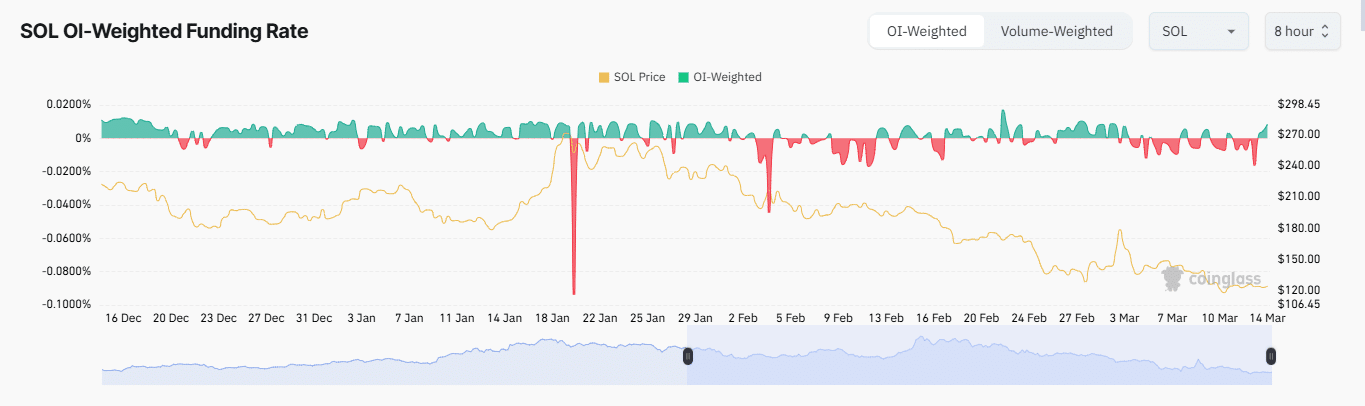
This buying sentiment can be further confirmed by the OI-weighted funding rate, which combines Open Interest and funding rate data to provide a more accurate market sentiment reading. At the time of writing, the sentiment had turned positive, registering at 0.0086% thanks to an uptrend that began on 13 March. This hinted at an increase in long positions.
If buying volume in the derivatives market remains strong and Solana reclaims the lost support at $128, a rebound could be imminent. Otherwise, the altcoin could fall even further.