- Tron’s active addresses and transactions increased last month.
- TRX fell under critical support, hinting at a continued price drop.
Tron [TRX] has witnessed a considerable surge in network activity in October. This clearly reflected a rise in the blockchain’s adoption. However, TRX couldn’t sustain this growing momentum as the scenario changed in November.
Tron’s October success
Lookonchain recently posted a tweet revealing Tron’s achievement of the first month of Q4. As per the tweet, the total number of transactions on the blockchain reached 238.6 million in October, rising 8.15% from the previous month.
Additionally, the number of transactions on Tron also reached a one-year high of 10.46 million on the 24th of October.
Since these numbers looked promising, AMBCrypto checked Artemis’ data to find out more about the blockchain’s network activity in October.
As per our analysis, like transactions, Tron’s daily active addresses also remained high throughout October, reflecting consistent usage of the blockchain.
Apart from all these, the blockchain’s performance on the captured value front was also promising. This was the case as both TRX’s fees and revenue increased last month.
However, the only sector where TRX underperformed was DeFi, as its TVL fell sharply.

Source: Artemis
Though most of the network activity metrics increased in October, Tron’s couldn’t sustain that trend in November. For instance, since the beginning of November, TRX’s active addresses dropped sharply from 2 million to 1.7 million.
Thanks to that, the blockchain’s transactions also fell, reflecting a dip in the blockchain’s usage. A similar declining trend was also noted on Tron’s fees and revenue charts in November.


Source: Artemis
What’s TRX up to?
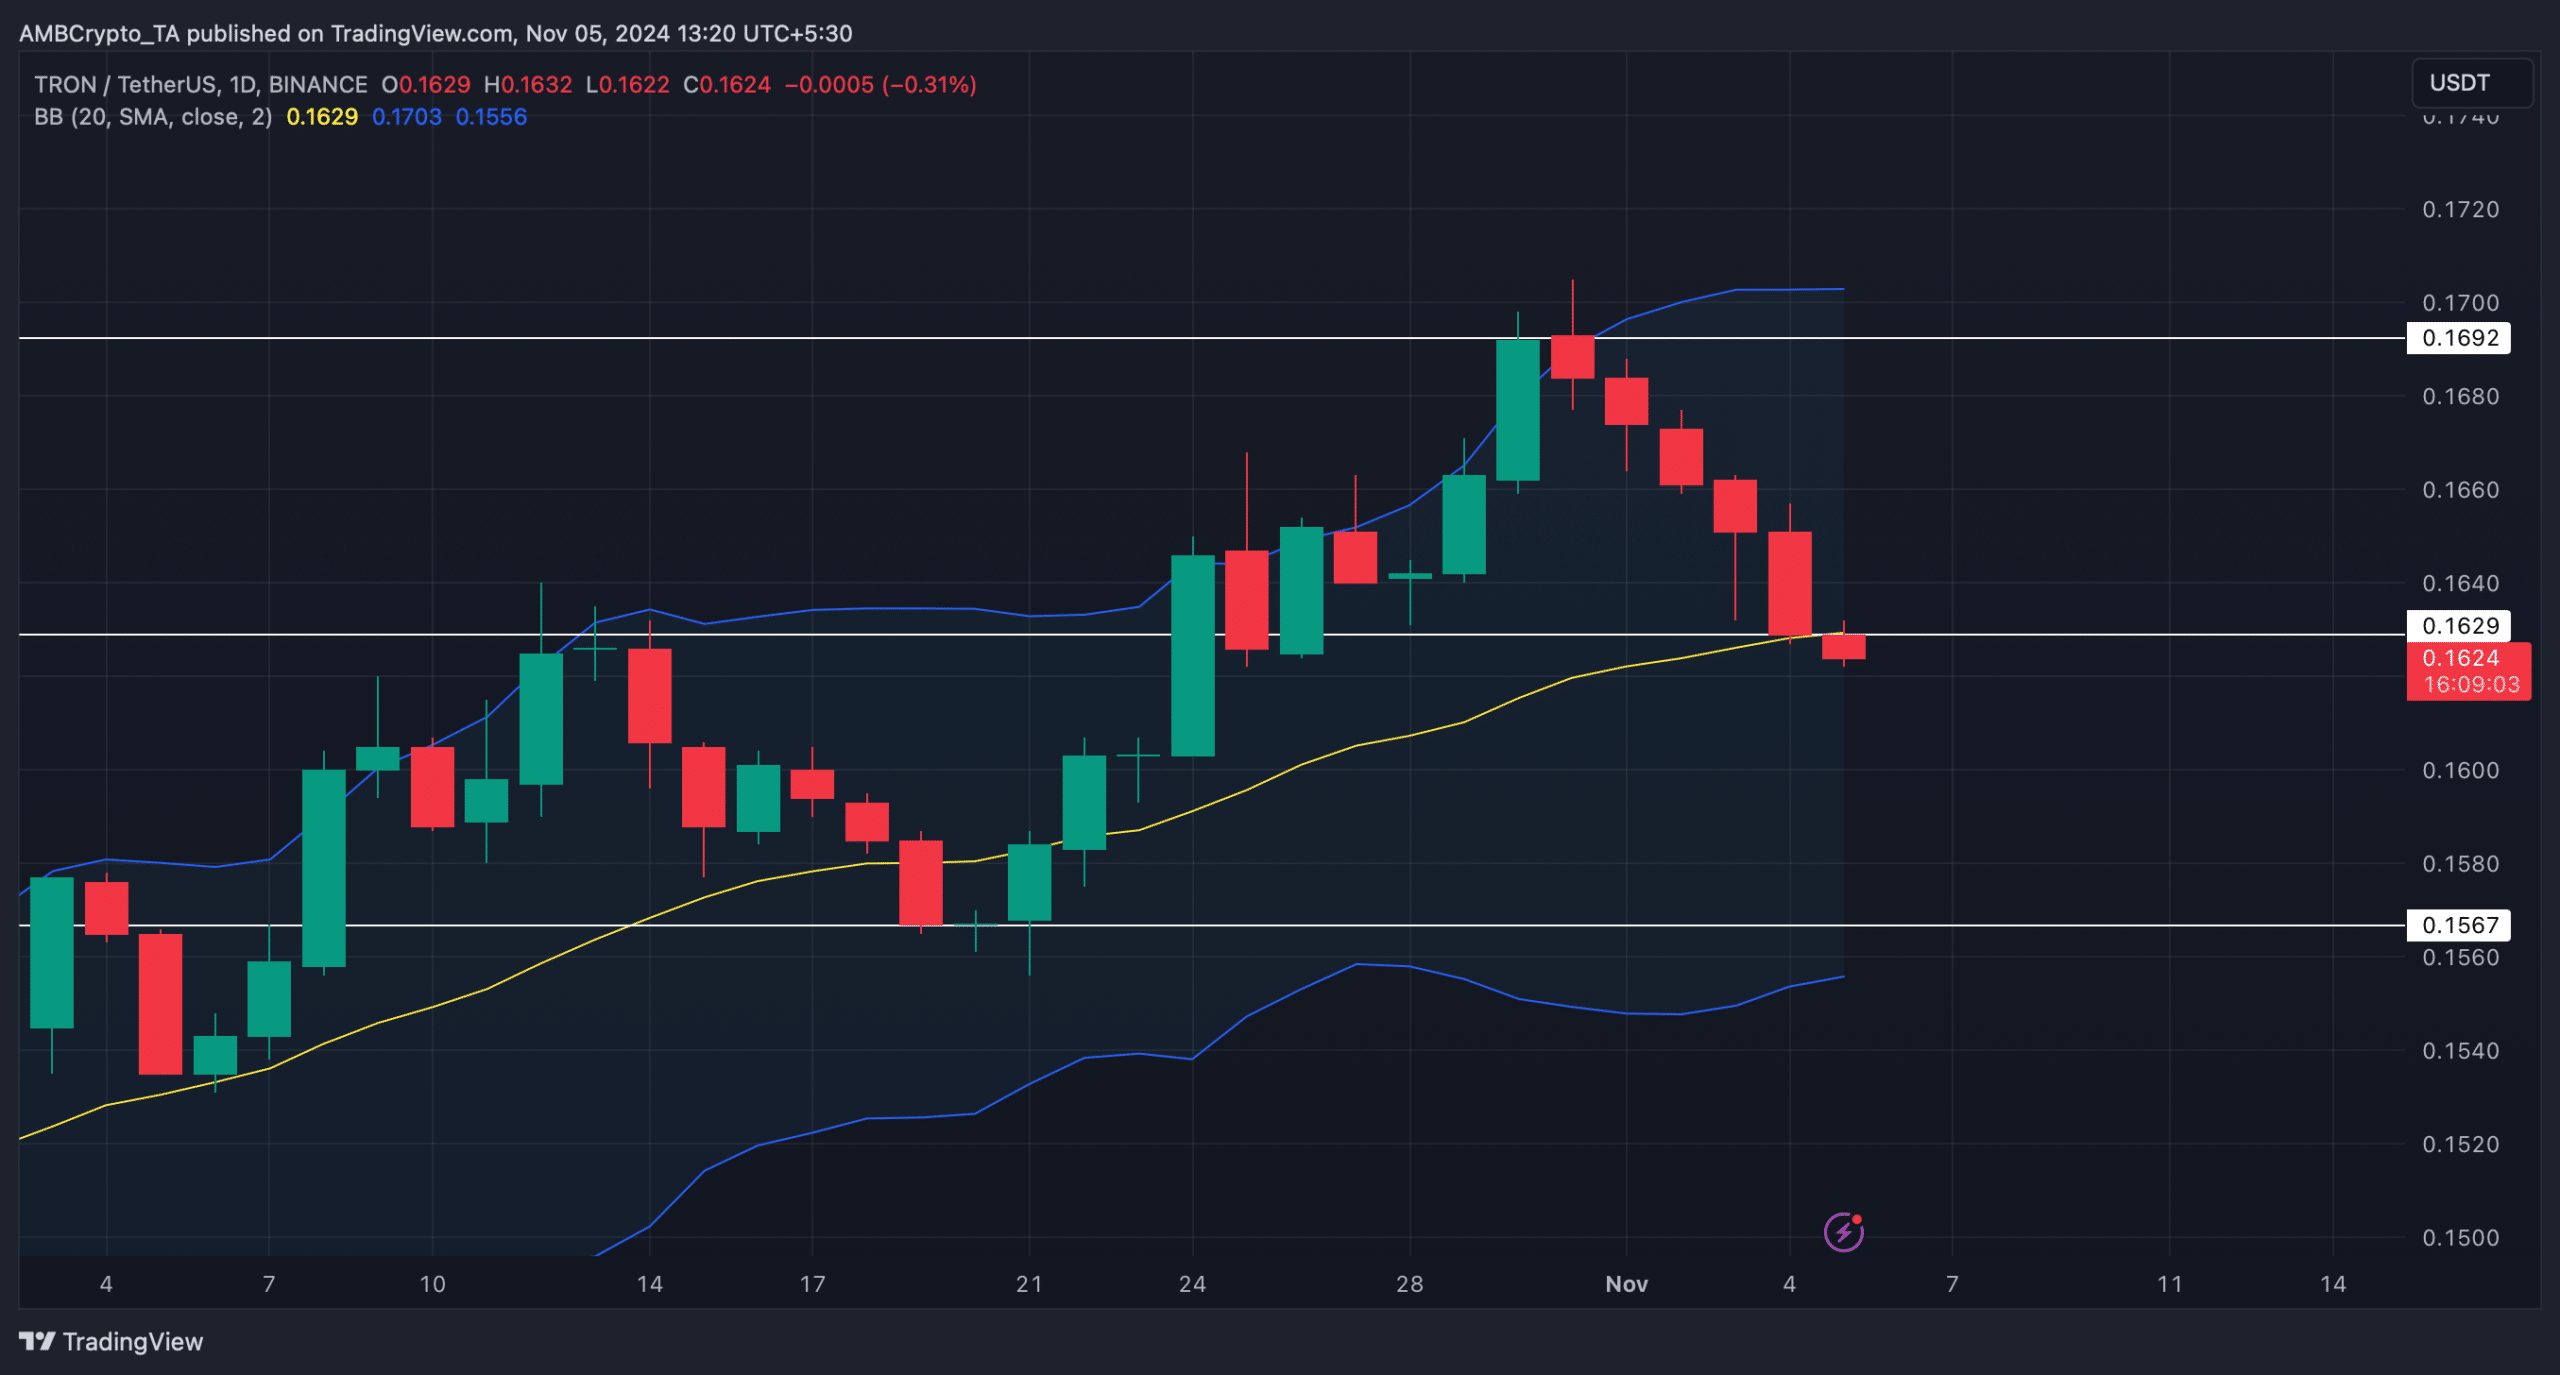
As we entered November, TRX’s price started to consolidate. This was the case as its value only moved marginally in the last seven days. At press time, it was trading at $0.1623. Nonetheless, there were chances for this bearish trend to change.
AMBCrypto’s look at Coinglass’ data revealed that its long/short ratio increased in the last 24 hours. A hike in the metric means that there are more long positions in the market than short positions, which can be inferred as a bullish development.


Source: Coinglass
Read TRON’s [TRX] Price Prediction 2024-25
However, TRX’s troubles were far from ending. We found that TRX slipped under its crucial support and its 20-day Simple Moving Average (SMA). This hinted at a continued price drop towards $0.15.


Source: TradingView

