
- Resistance at $3,353 could force ETH to decline to $3,120.
- In the midterm, the price might fail to surpass $4,000.
Ethereum’s [ETH] rise to $3,300 on the 28th of April returned optimism to the market. However, according to AMBCrypto’s analysis, the joy market participants might have had could be momentary.
One reason for this prediction could be linked to a recent transaction. In the early hours of the same day, a participant sent 14,999 ETH to the Coinbase exchange.
While we have not been able to track who the exact culprit was, the transfer could affect ETH’s price. This is because a large number of coins sent to exchange usually end up in a sale.
Also, depending on the volume, the sale could stop the value from moving higher.
High liquidity comes with resistance
Hence, it could be that ETH’s surge in the last 24 hours was a false breakout.
For context, a false breakout is terminology that explains how a cryptocurrency tries to break certain resistance but loses momentum afterward.
Without looking at other indicators, this conclusion might sound too hasty. Hence, AMBCrypto decided to examine other parts of the market related to the altcoin.
One indicator we gauged was the liquidation heatmap. For most people, the liquidation heatmap helps to track high liquidity in the order book.
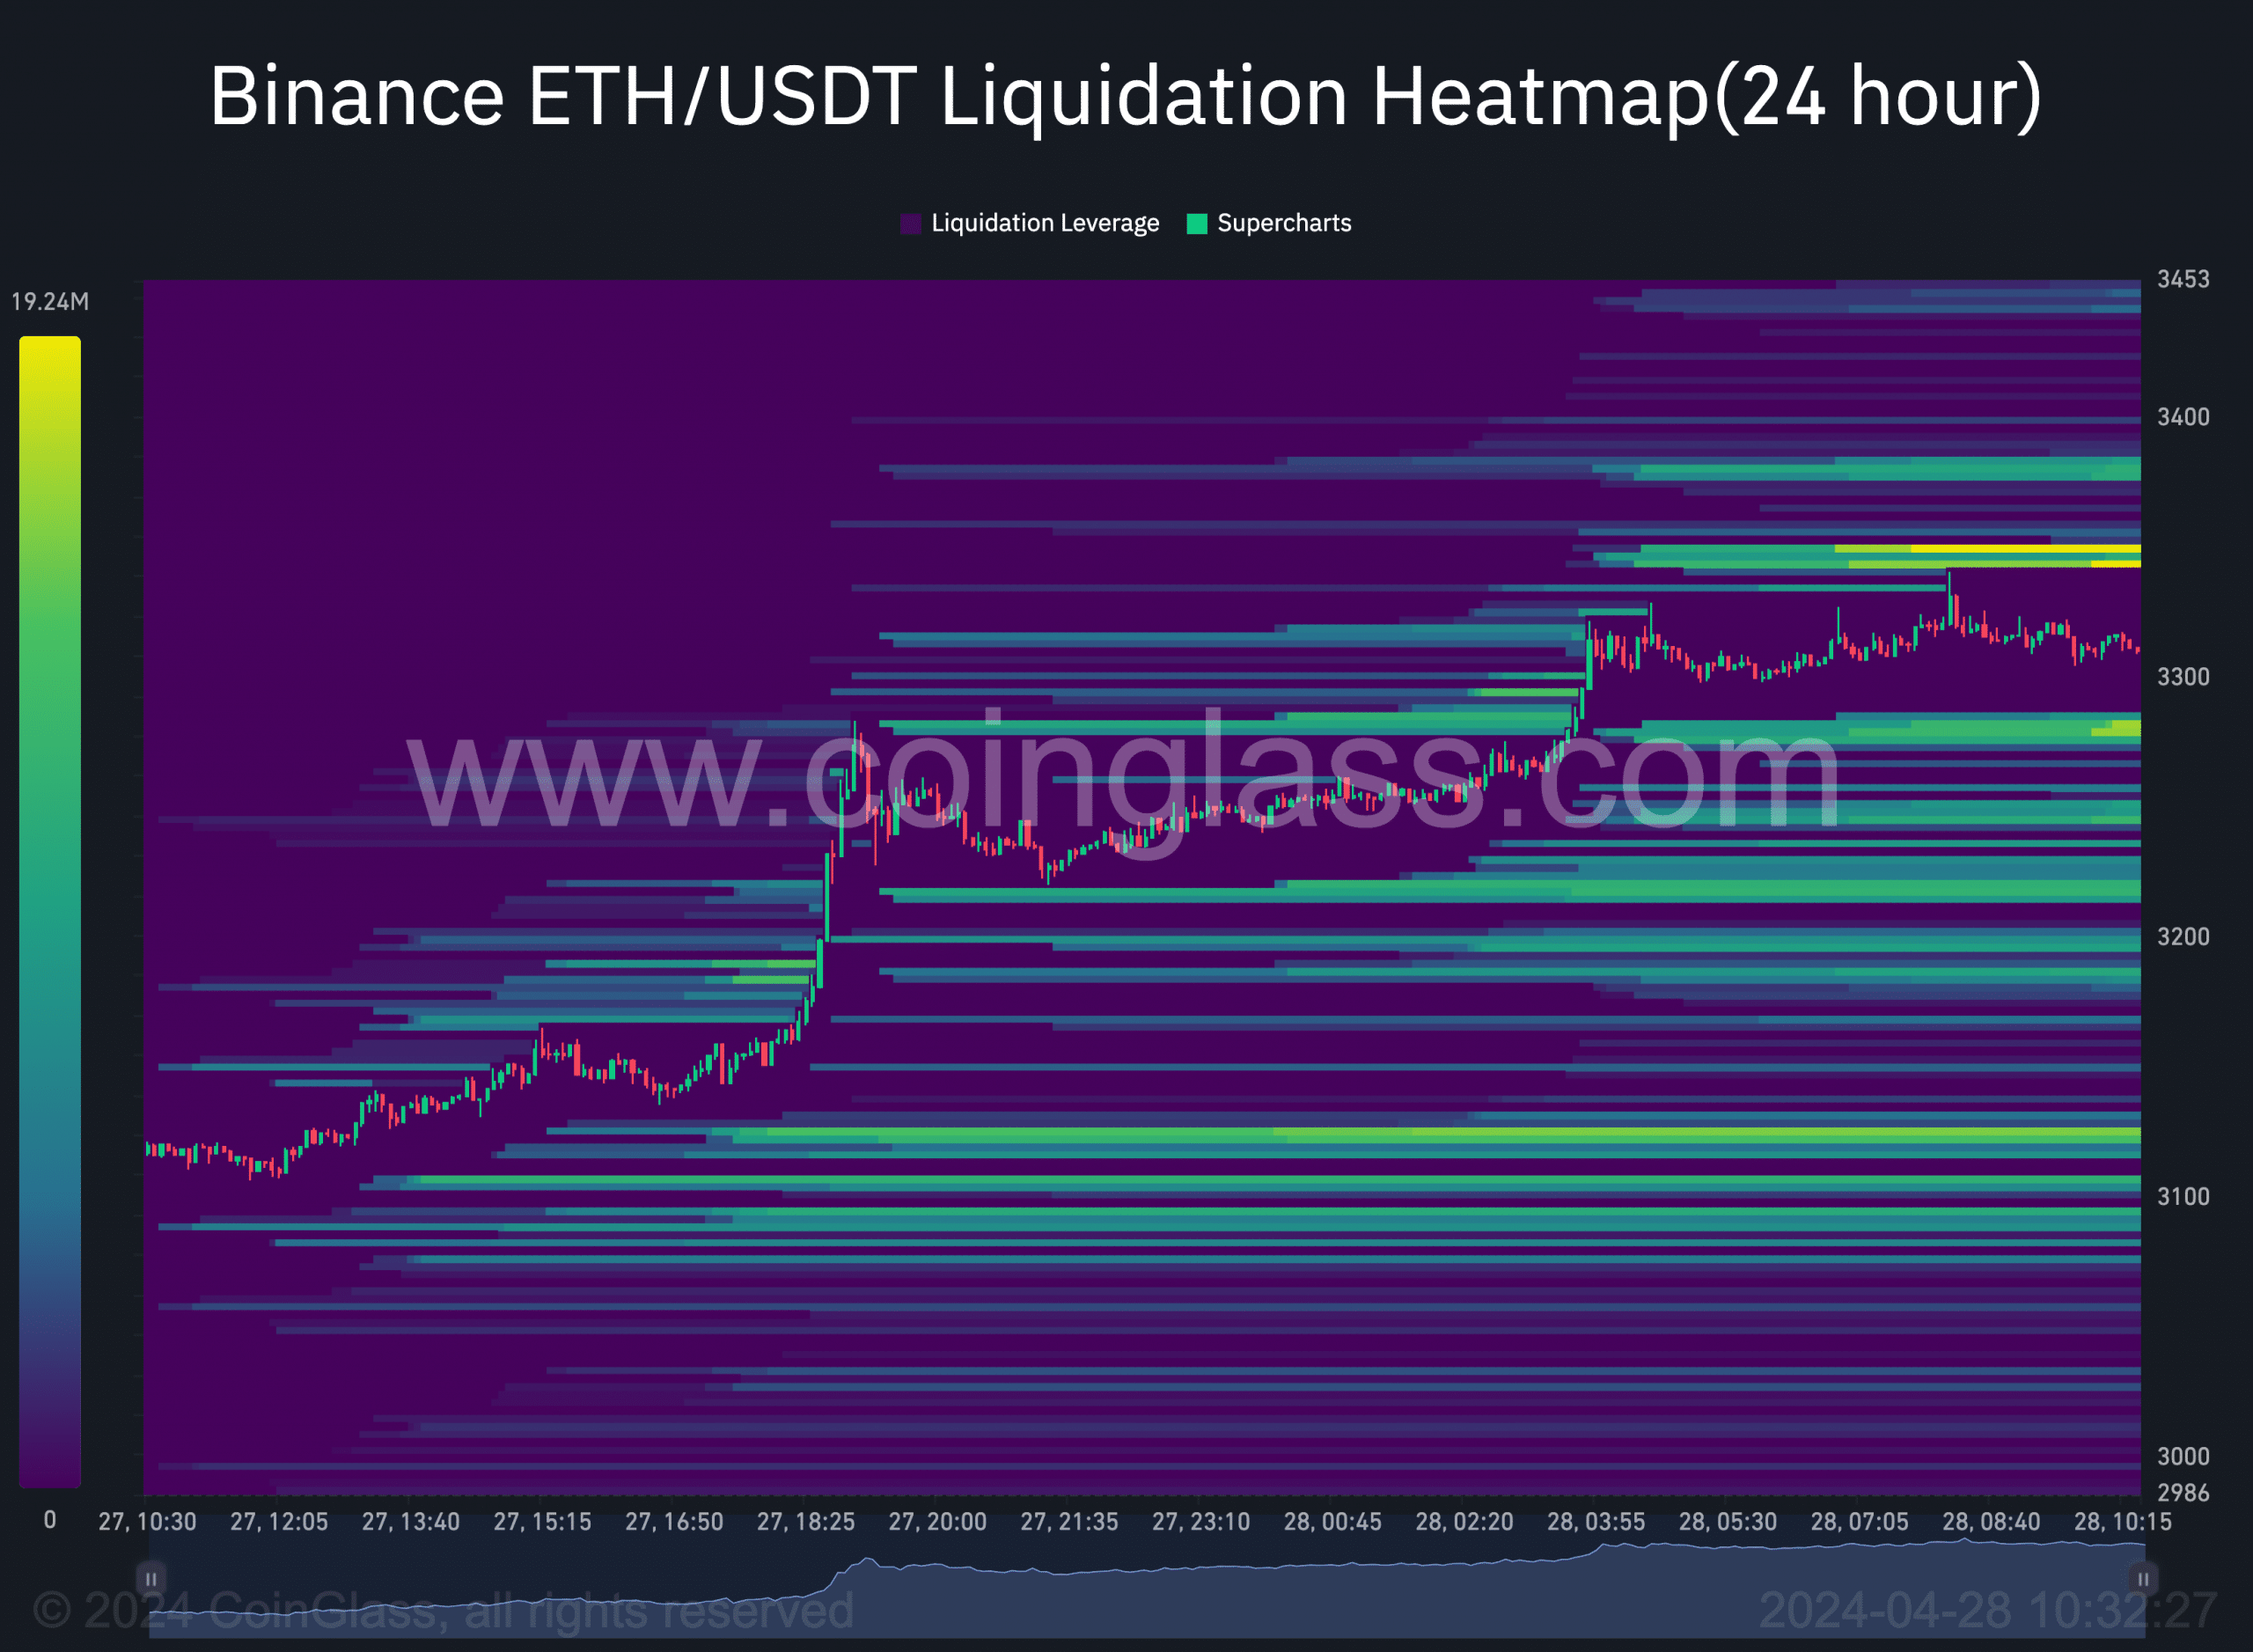
Source: Coinglass
However, the same indicator can be instrumental in identifying support and resistance zones. From the data above, there was a concentration of liquidity at $3,353.
In areas like this, large trades can be executed at relatively good prices. But as soon as orders enter this liquidity, the price might reverse. As such, the $3,353 region could be a resistance point for ETH.
$4K is not close
Moving on, the value of the cryptocurrency might drop once it hits the price mentioned above. However, support lied at $3,276, indicating that ETH might not slip below the level.
The next part we considered was the Cumulative Liquidation Levels Delta (CLLD). If positive, the CLLD indicates that there are more long liquidations.
On the other hand, a negative CLLD suggests that short liquidations were more than longs. As of this writing, the CLLD was positive. But this indicator also has a say on the price.
With the press time position, the CLLD indicated that ETH could undergo a full retrace. Should this be the case, the price of the cryptocurrency might drop to $3,120.
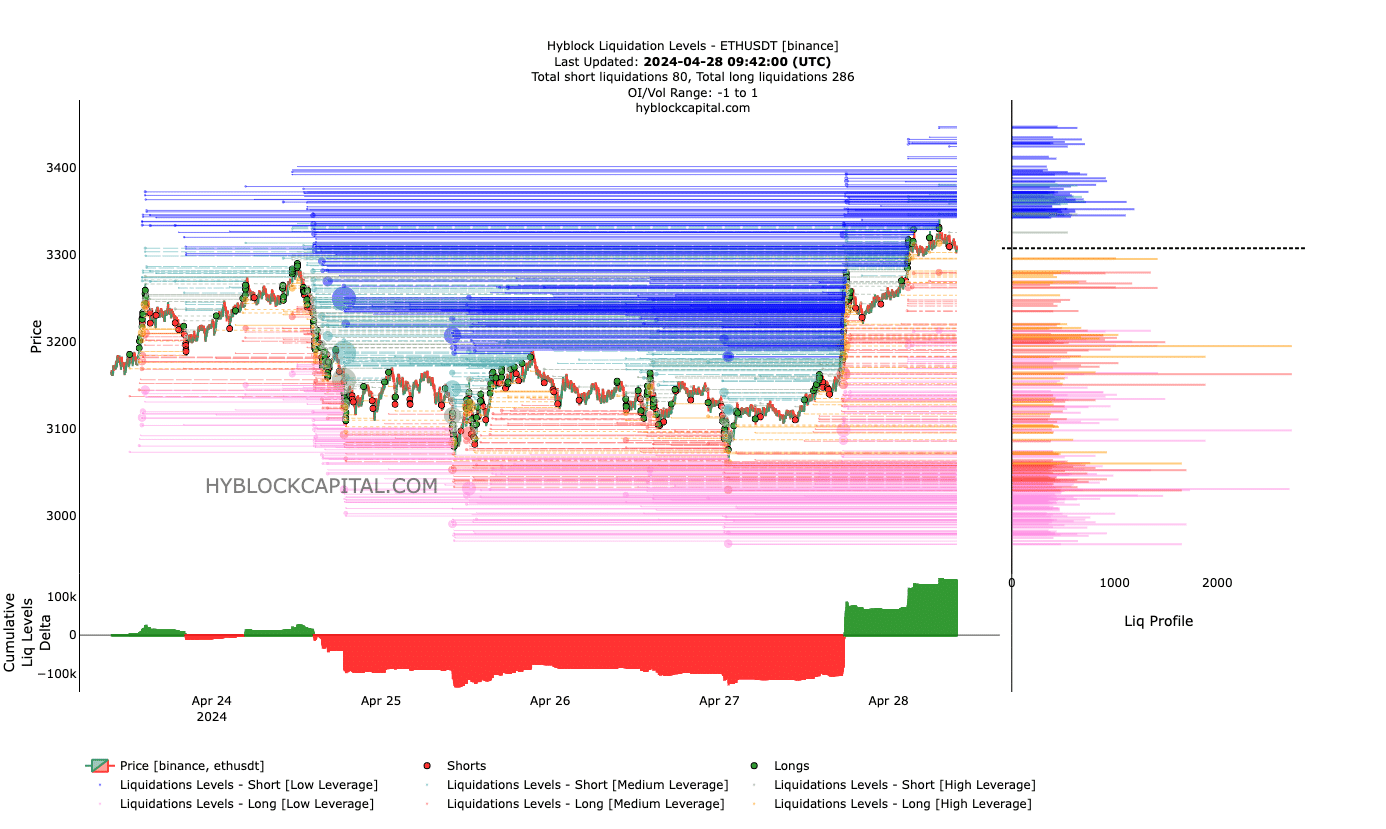
Source: Hyblock
Is your portfolio green? Check out the ETH Profit Calculator
In the meantime, the price of the cryptocurrency might keep its head above $3,300 for some time. However, expecting this increase to drive ETH to $4,000 might be a stretch.
Our assessment showed that the market lacked enough firepower to drive such a hike. In addition, expecting the altcoin to surpass its all-time high might not be an option anytime soon.