
- Litecoin has broken above an ascending triangle pattern amid a rise in buying volumes.
- Exchange inflow data shows that sellers remain absent, suggesting confidence in the uptrend.
Litecoin [LTC] is up 12% in the last 30 days and up by 5% in the last seven days. At press time, LTC traded at $69 with an over 16% rise in trading volumes per CoinMarketCap.
Litecoin broke out of an ascending triangle pattern on the one-day chart after overcoming strong resistance at $67. This breakout suggests strong bullish momentum.
The breakout has also been accompanied by a rise in buying pressure. The volume histogram bars, which are green, suggest that buyers have overwhelmed sellers, making the case for a sustained rally above this breakout zone.
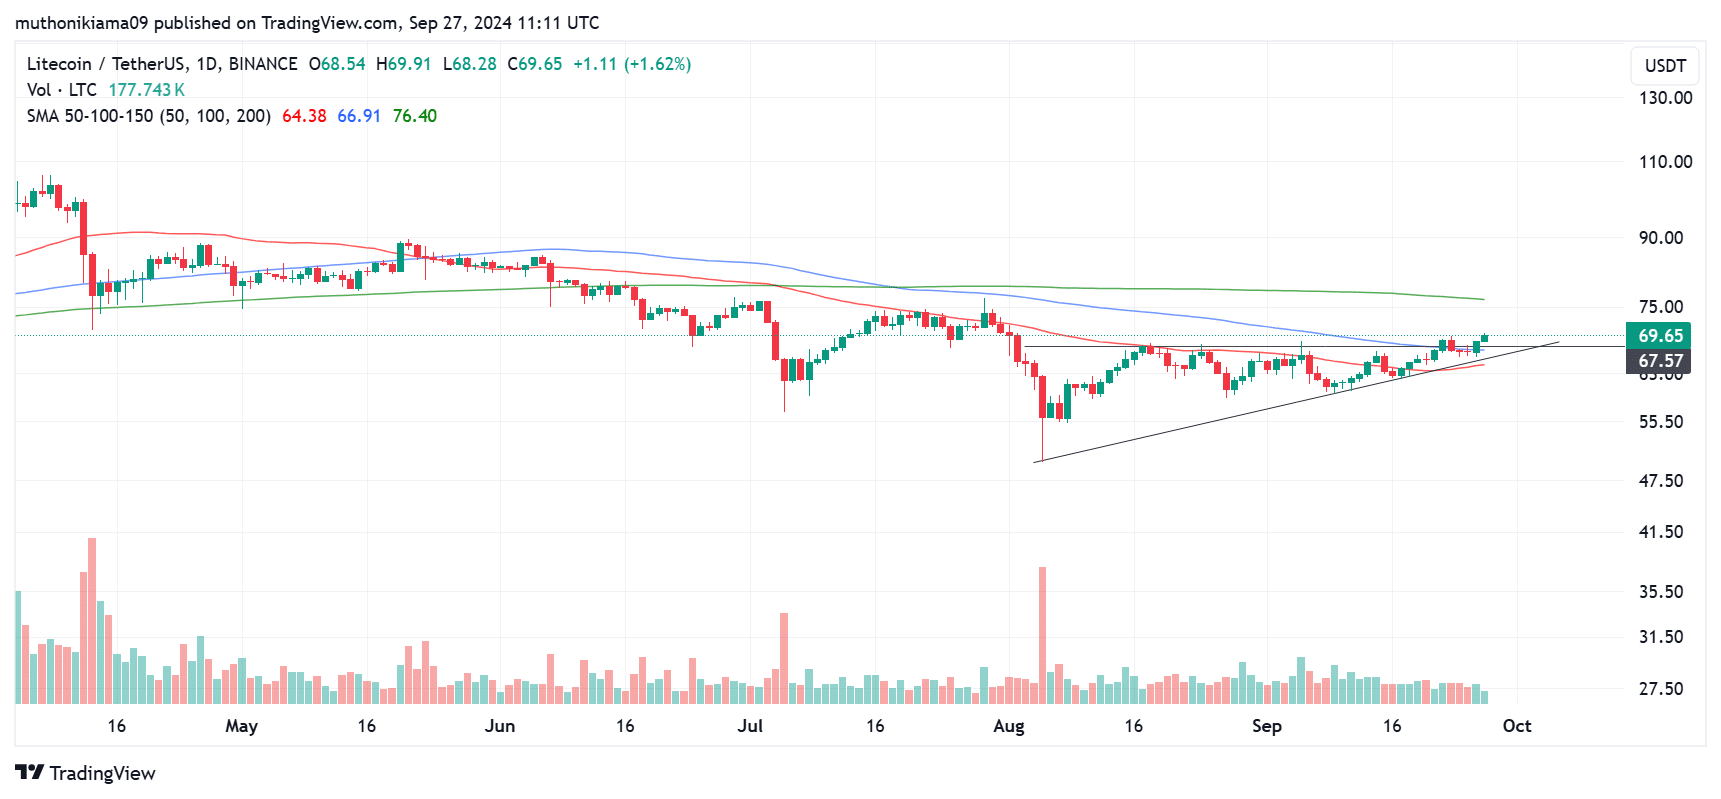
Source: TradingView
The bullish momentum is gaining strength after the price broke above the 100-day Simple Moving Average (SMA). If this trend continues, the next target for LTC will be the 200-day SMA at $76.
Technical indicators flip bullish
The Moving Average Convergence Divergence (MACD) indicator strengthens the bullish case for Litecoin. The MACD histogram bars have flipped green, and are positive. This indicates that the current uptrend is strong.
The MACD line is also positive and moving above the signal line, which further confirms that bulls are in control.
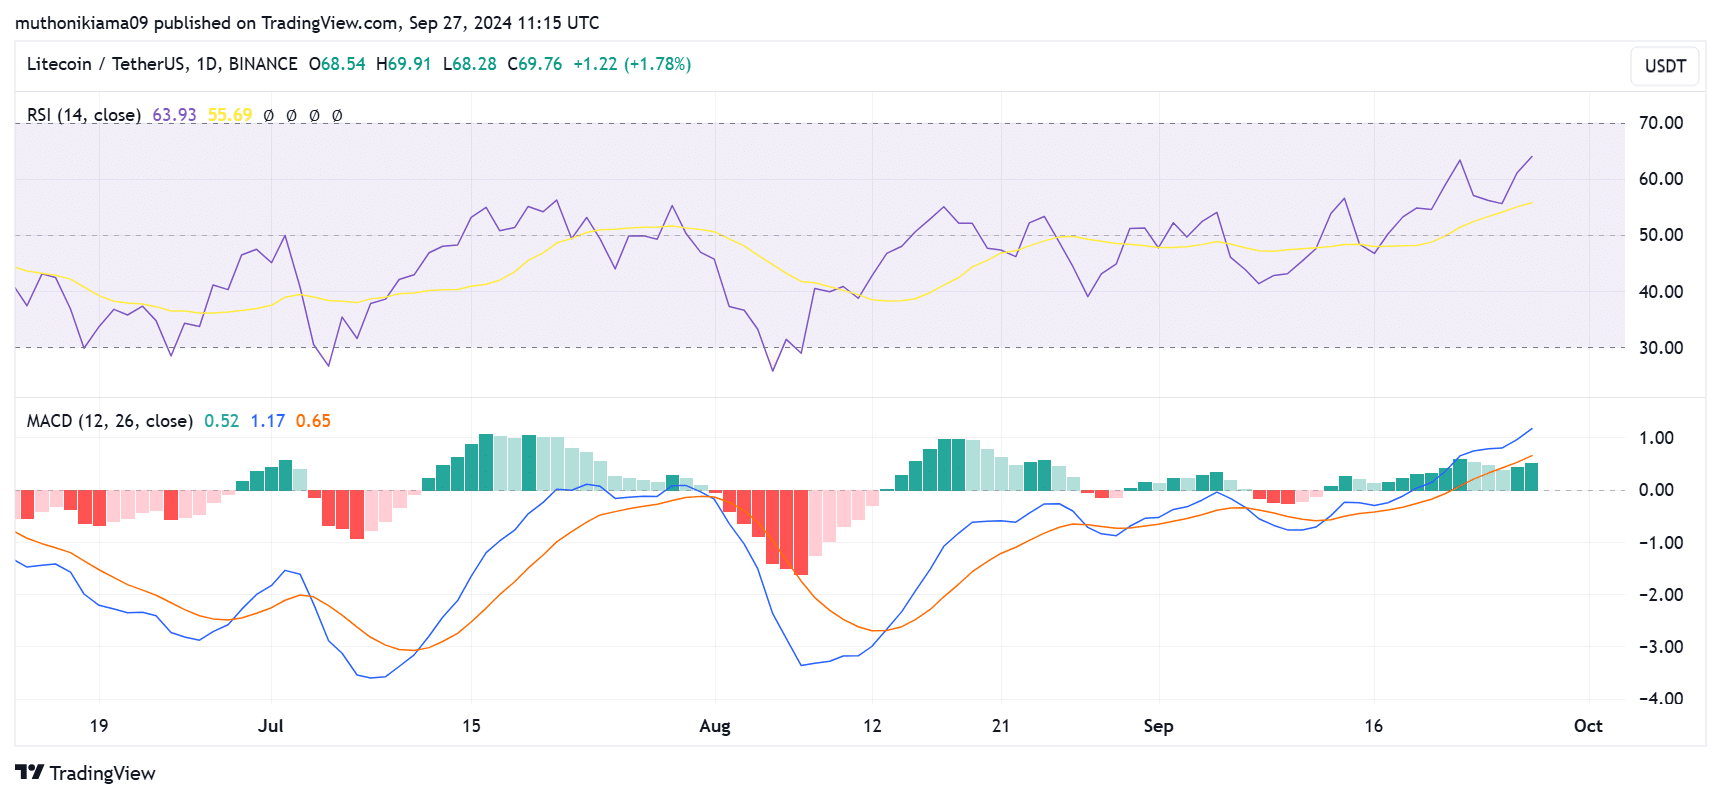
Source: TradingView
A look at the Relative Strength Index (RSI) line at 63 shows that buyers have overwhelmed sellers. The RSI line has also made higher highs since August, showing rising interest in LTC.
If the selling activity remains subdued and buyers continue to drive the action, Litecoin could be poised for further gains.
According to exchange inflow data, since LTC broke above $66, there has been a notable decrease in exchange inflows, suggesting a lack of interest in selling and confidence in the rally.
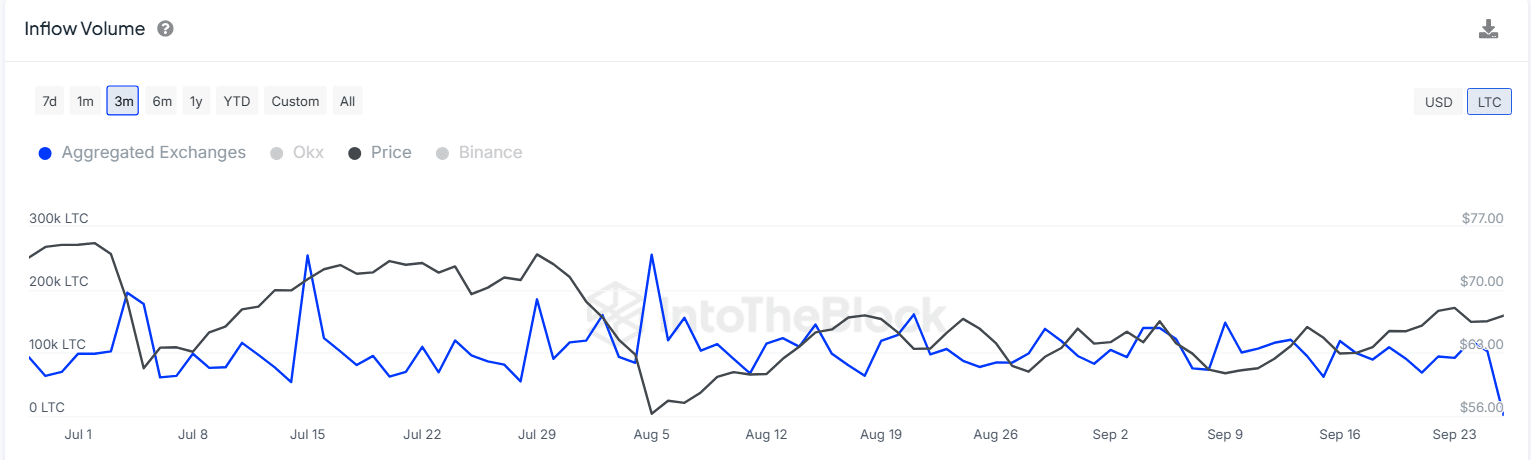
Source: IntoTheBlock
Liquidation data and Funding Rates
Litecoin is approaching a high liquidity zone above $70. High liquidity zones tend to act as strong resistance levels due to a high amount of selling pressure that makes it challenging for the price to move higher.
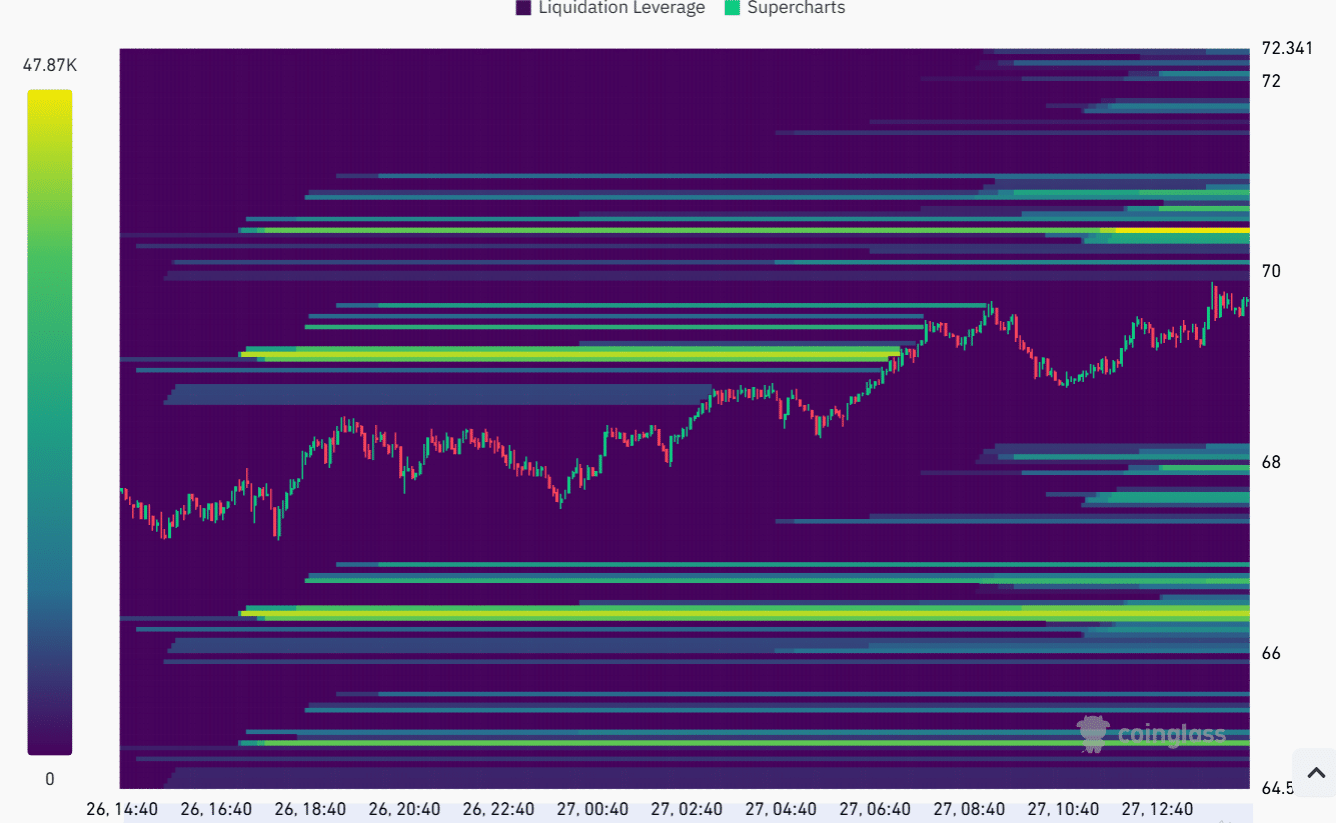
Source: Coinglass
If LTC continues to gain and enters this zone, it could trigger price volatility. However, if there is a large number of buy orders that strengthen the bullish momentum, LTC could break through.
Read Litecoin’s [LTC] Price Prediction 2024–2025
A look at Funding Rates on Coinglass also shows that there is positive sentiment around Litecoin.
LTC Funding Rates have been predominantly positive over the past seven days, suggesting that a majority of traders are long and betting on further price increases.