- XRP surpasses 1.618 Fibonacci level, analysts eye a potential 6,800% rally to $168 this cycle.
- Strong uptrend confirmed as XRP trades above 20, 50, 100, and 200-day EMAs, showing bullish momentum.
XRP’s price action is attracting attention as analysts reference historical Fibonacci extensions to predict potential long-term targets. Following a breakout from a six-year triangular consolidation, XRP was trading at $2.37 at press time with a 24-hour volume of $20 billion.
Despite a 5.32% decline over the past day, the asset’s technical indicators and historical fractals suggest the possibility of substantial gains in the ongoing market cycle.
Market data reveals a circulating supply of 57 billion XRP, giving it a market capitalization of $135.17 billion. Analysts argue that XRP’s breakout mirrors its 2017 bull cycle, where the asset saw a more than 600x surge, reaching its all-time high of $3.40.
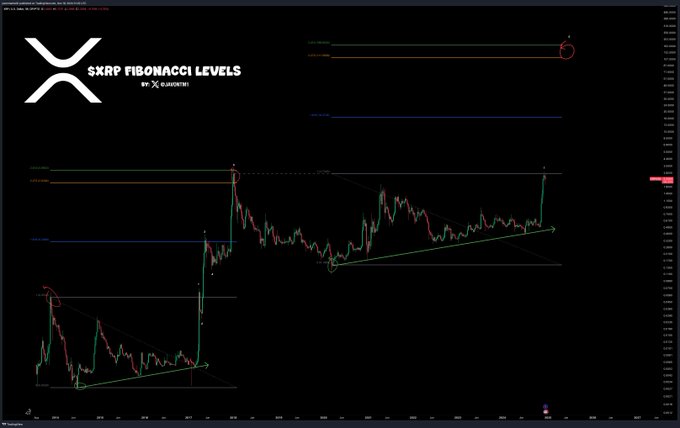
Current projections suggest the cryptocurrency could rally to $168, aligning with the 2.414 Fibonacci extension level, should a similar performance occur.
Fibonacci levels provide key targets for price projections
Historical price movements play a central role in the current analysis. During the 2017 rally, XRP respected Fibonacci levels, reaching the 2.414 extension before peaking.
Javon Marks, a crypto analyst, noted that XRP’s past alignment with these levels adds credibility to the current projection of a potential 6,800% rally.

Source: X
In the present cycle, the 1.618 Fibonacci level has already been surpassed, with further price extensions aiming toward $4.50 and $13.00 as intermediate targets before reaching the $168 mark.
However, this optimistic scenario hinges on sustained momentum and broader market support. The confirmation of XRP’s macro bull run comes as global crypto adoption increases and pro-crypto policies gain traction.
Technical indicators suggest bullish momentum
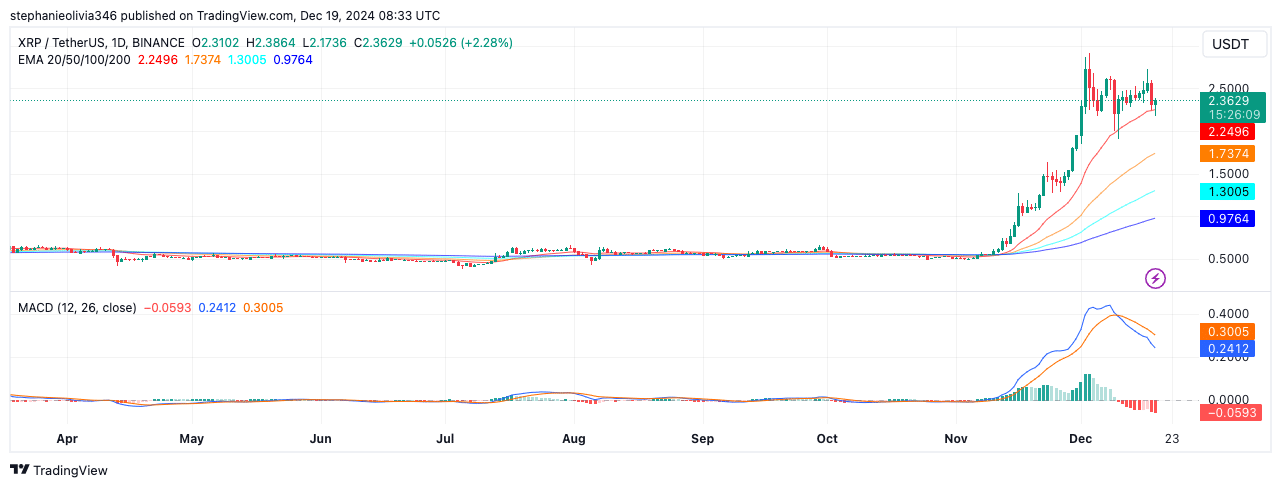
Recent technical patterns confirm bullish momentum for XRP. The asset’s price remains above the 20, 50, 100, and 200-day EMAs, currently at $2.25, $1.73, $1.30, and $0.97, respectively. These levels indicate that XRP is firmly in an uptrend.


Source: TradingView
The MACD remains in bullish territory, with the MACD line (0.30) above the signal line (0.24). However, a slight decline in the histogram suggests reduced momentum in the short term.
A potential retracement toward the $2.25 EMA support could act as a consolidation phase before further upward movement. Maintaining this support level could allow XRP to retest recent highs near $2.50.
Derivatives data points to increased activity
XRP derivatives markets reflect increased interest, with a 10.34% rise in trading volume, reaching $24.49 billion. Although open interest has declined by 12.08%, likely due to profit-taking, options volume surged by 17.41%, showing heightened speculative activity.
Options open interest also grew by 16.20%, highlighting ongoing hedging interest.


Source: Coinglass
Long/short ratios on Binance and OKX indicate a bullish tilt, with Binance’s top trader long/short ratio standing at 3.08.
Read XRP’s Price Prediction 2024–2025
However, liquidation data reveals $40.32 million in liquidations over 24 hours, predominantly affecting longs, suggesting near-term volatility despite the overall bullish sentiment.
This technical and market data points to XRP’s potential for growth as part of a broader cryptocurrency bull market.

